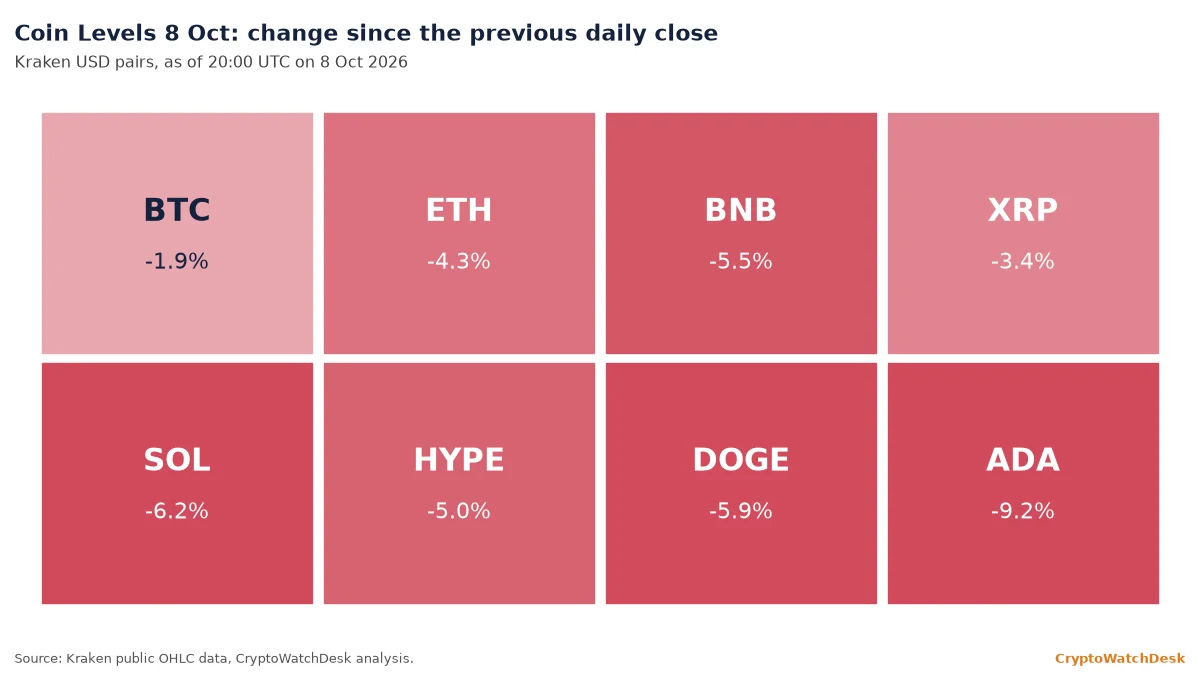
Coin Levels is scenario analysis, not investment advice. Prices as of 20:00 UTC.
Coin Levels 8 Oct: market context
Bitcoin fell from about $82,650 to $80,980 within the 15:00 UTC hour on Kraken and reached $80,328.6 in the 17:00 UTC hour, its lowest level since 20 Sep. It recovered to about $81,700 by 20:00 UTC, down 1.9% from Wednesday’s close.
Oil set the backdrop. Brent crude rose to about $105.9 a barrel during the day and eased to roughly $103.5 after President Donald Trump said the US would not attack Iran before the midterm elections, according to CNBC. The US 10-year Treasury yield eased to about 5.23%.
Flows remain a headwind on the last full print. US spot bitcoin ETFs lost $484.9 million on Wednesday, the most since 25 Jun, according to Farside data. Thursday’s figures were not yet published. ETF Desk on Wednesday’s outflows Derivatives moved less than spot. Funding on Deribit’s bitcoin perpetual rose from about 0.001% to roughly 0.009% per eight hours during the day, and DVOL, Deribit’s 30-day implied volatility index, peaked at 39.4 before easing to 37.9, according to Deribit’s public data. Equities offered no cushion. The S&P 500 closed 0.5% lower at 7,765 and the Nasdaq fell 1.3%, while Coinbase shares lost 3.6% to $172.00, according to Yahoo Finance data. Crypto-linked stocks and spot prices fell together on Thursday, so the levels below were tested without support from either market. The next ETF print, for Thursday, will show whether fund holders followed spot lower.
All indicators use Kraken daily closes through 7 Oct. The 20-day exponential moving average (EMA) weights recent prices more heavily; the 50-day simple moving average (SMA) is a plain average of 50 closes; the relative strength index (RSI) is a 0-100 momentum gauge.
Related: What an EMA is
Bitcoin price analysis
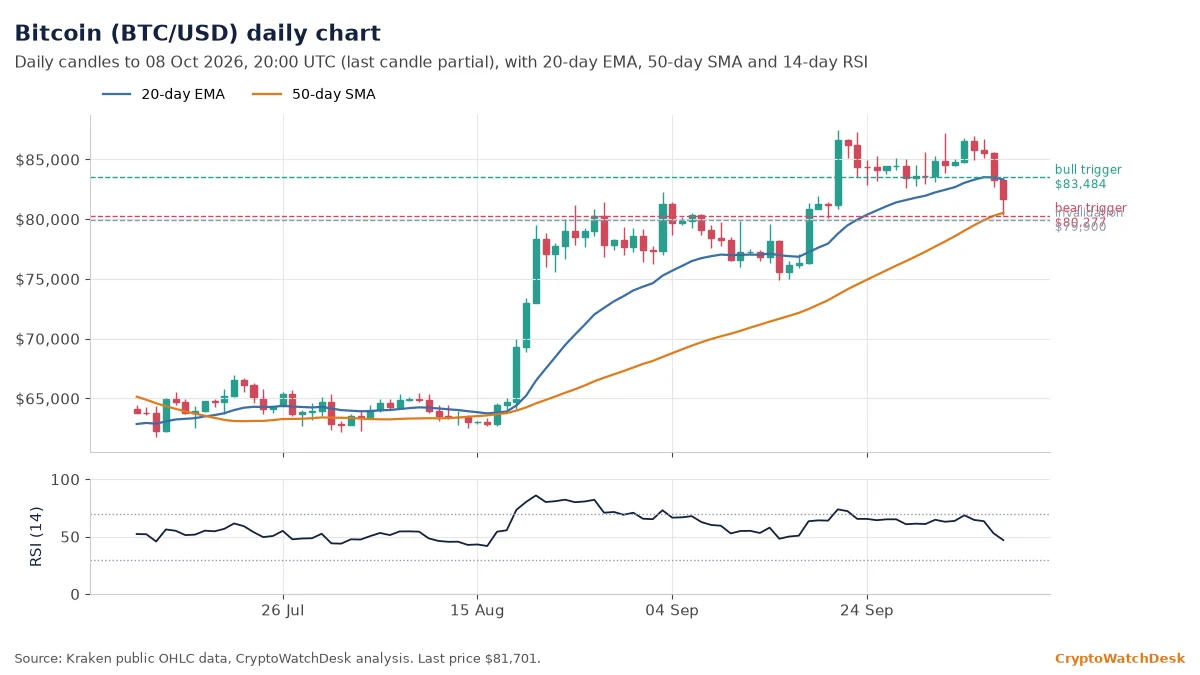
Bitcoin trades below its 20-day EMA at $83,484 and about 1.8% above its 50-day SMA at $80,277. Thursday’s low of $80,328.6 stopped just above that average. The RSI reads 52.8, down from 63.5 two days ago, which is neutral.
If buyers push and hold above $83,484, the price could climb back toward $85,800. A daily close below $80,277 would open the way to $77,000, roughly midway to the 30-day low of $74,891.5. The bullish structure is invalidated on a daily close below $79,900.
Thursday’s 24-hour range ran from $80,328.6 to $83,559.4, about 4%. Bitcoin is about 7% below its 30-day high of $87,446.7 and about 14% above its 200-day SMA at $71,728. The bounce from $80,328.6 recovered about $1,400 by 20:00 UTC, so the test of the 50-day SMA has held so far on an intraday basis.
Ethereum price analysis
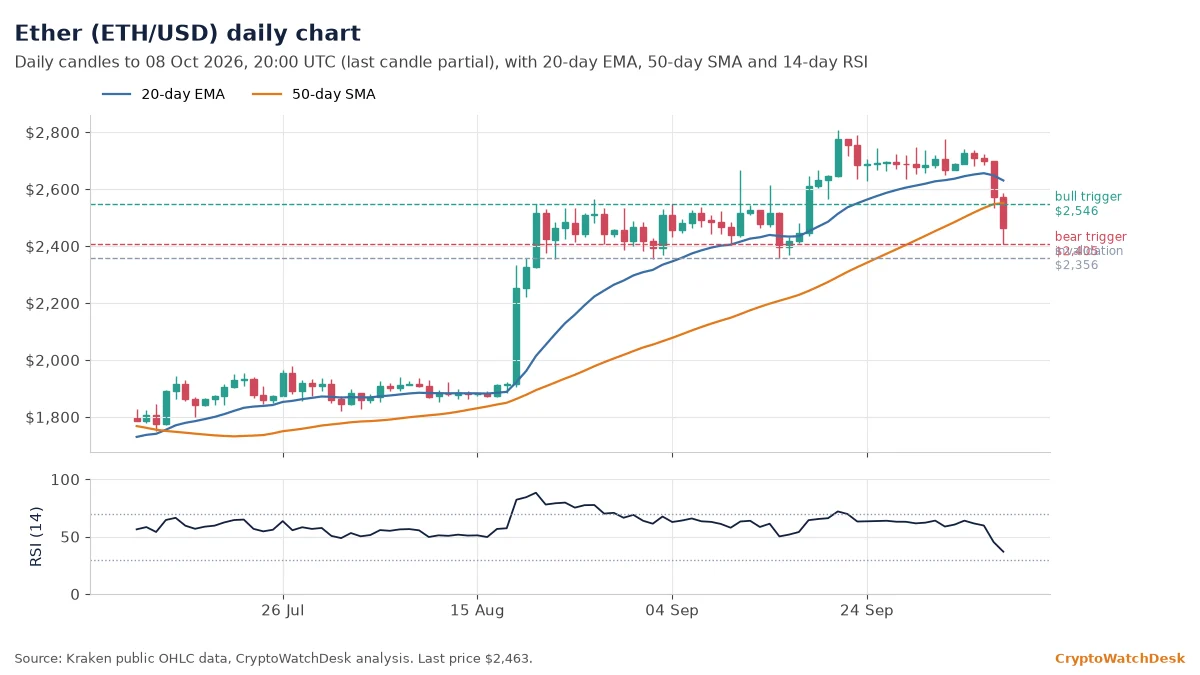
Ether traded near $2,463, below both its 20-day EMA at $2,647 and its 50-day SMA at $2,546. The RSI reads 45.3, the first sub-50 reading in this series this month.
If buyers push and hold above $2,546, the price could climb toward $2,647. A daily close below $2,405, Thursday’s low, would open the way to $2,356, the 30-day low. The September upswing is invalidated below $2,356.
Ether’s 24-hour range was $2,405.35 to $2,585.31. It now trades about 12% below its 30-day high of $2,806.69 and about 4.5% above its 30-day low, the level that defines the bearish branch.
BNB price analysis
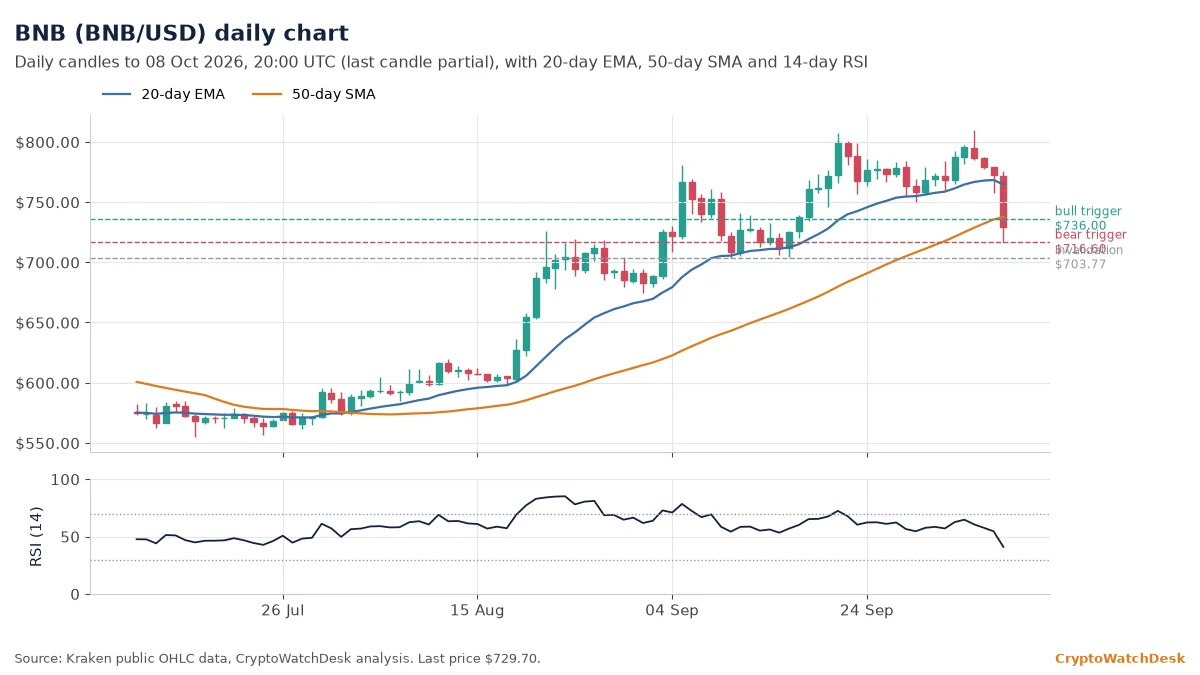
BNB traded near $729.70, below its 20-day EMA at $768.29 and just under its 50-day SMA at $735.56. The RSI reads 54.6. After holding up best on Wednesday, it fell 5.5% on Thursday.
If buyers push and hold above $736, the price could climb toward $768. A daily close below $716.60, Thursday’s low, would open the way to $703.77, the 30-day low. The trend is invalidated below $703.77.
BNB’s 24-hour range, from $716.63 to $775.82, was about 8% wide, double bitcoin’s. It is about 10% below Monday’s 90-day high of $809.78.
XRP price analysis
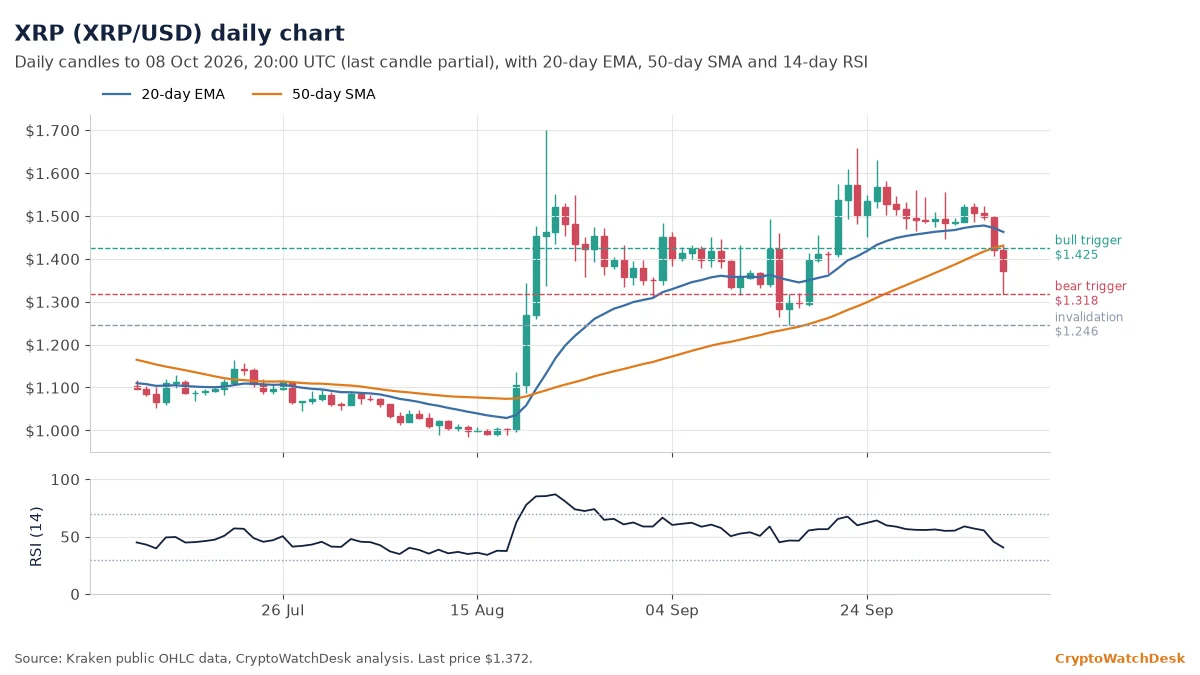
XRP traded near $1.372, below its 20-day EMA at $1.472 and its 50-day SMA at $1.425. The RSI reads 45.5.
If buyers push and hold above $1.425, the price could climb toward $1.472. A daily close below $1.318, Thursday’s low, would open the way to $1.246, the 30-day low. The bullish reading is invalidated below $1.246.
XRP’s 24-hour range ran from $1.3177 to $1.4287. It is about 17% below its 30-day high of $1.6578 and about 7% above its 200-day SMA at $1.28.
Solana price analysis
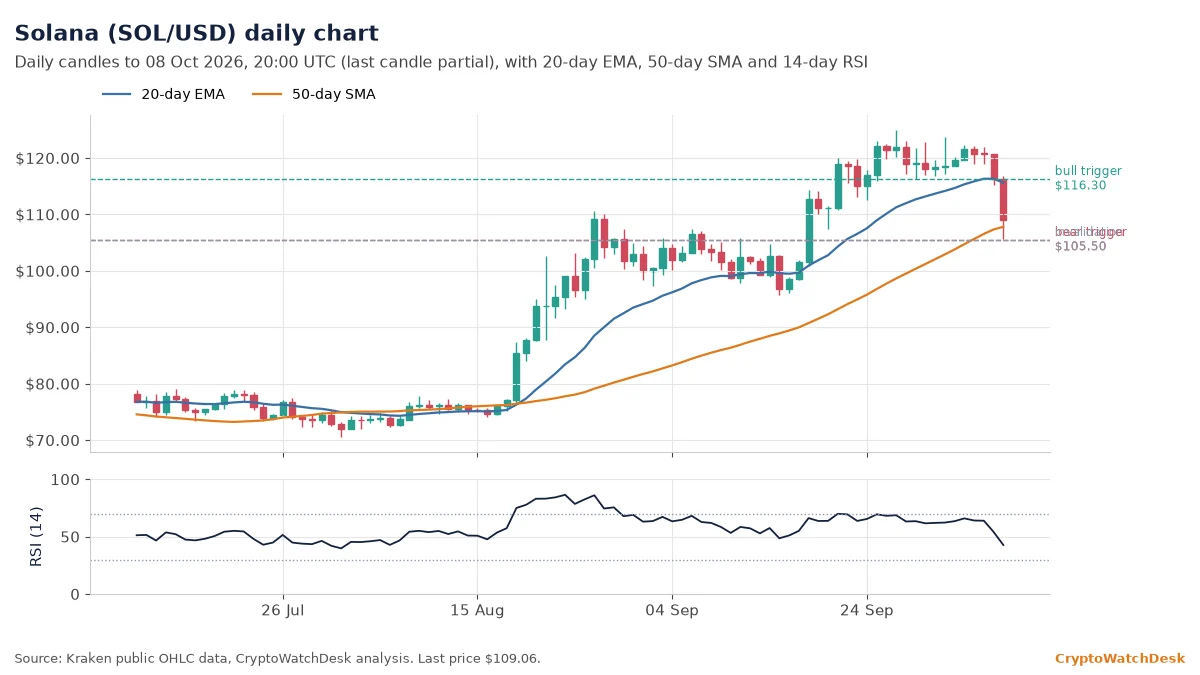
SOL traded near $109.06, below its 20-day EMA at $116.28 and about 1.6% above its 50-day SMA at $107.30. Thursday’s low of $105.57 briefly broke that average. The RSI reads 54.1.
If buyers push and hold above $116.30, the price could climb toward $121.50. A daily close below $105.50 would open the way to $95.73, the 30-day low. The September advance is invalidated below $105.50.
Solana’s 24-hour range of $105.57 to $116.74, about 11%, was among the widest of the eight. It sits about 13% below its 30-day high of $124.91.
Hyperliquid price analysis
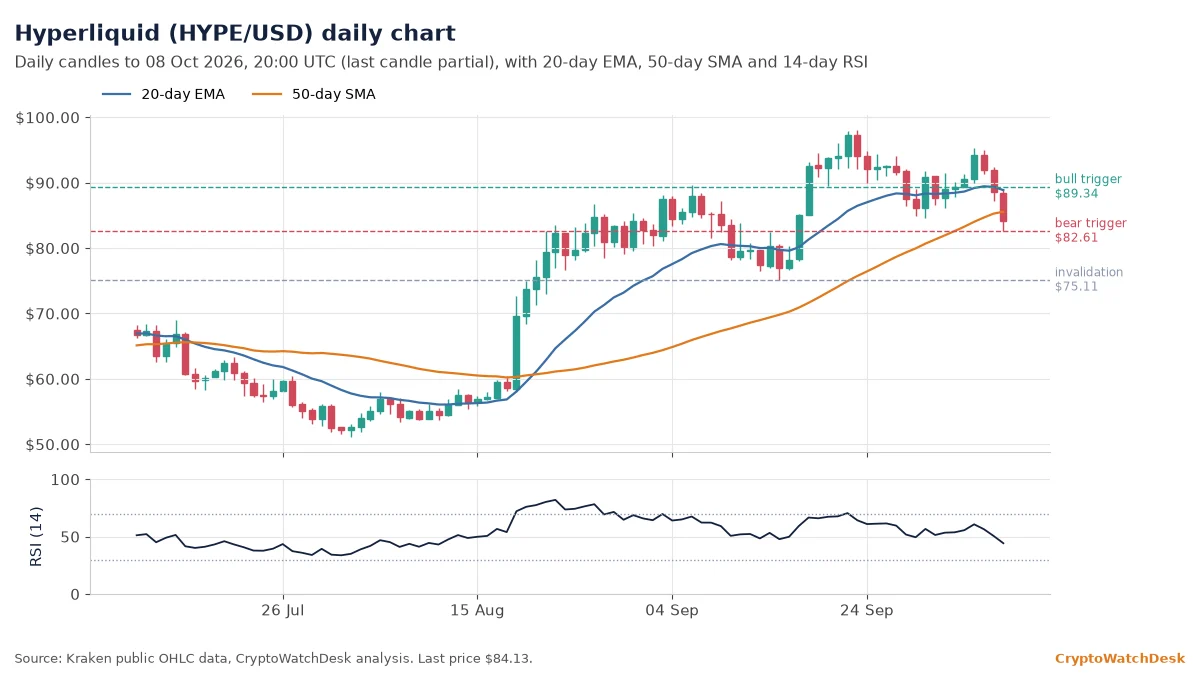
HYPE traded near $84.13, below its 20-day EMA at $89.34 and its 50-day SMA at $85.25. The RSI is a neutral 50.6.
If buyers push and hold above $89.34, the price could climb toward $92.40. A daily close below $82.61, Thursday’s low, would open the way to $75.11, the 30-day low. The uptrend is invalidated below $75.11.
HYPE’s 24-hour range was $82.61 to $88.83. It sits about 14% below its 30-day high of $98.02 but still about 37% above its 200-day SMA at $61.47.
Dogecoin price analysis
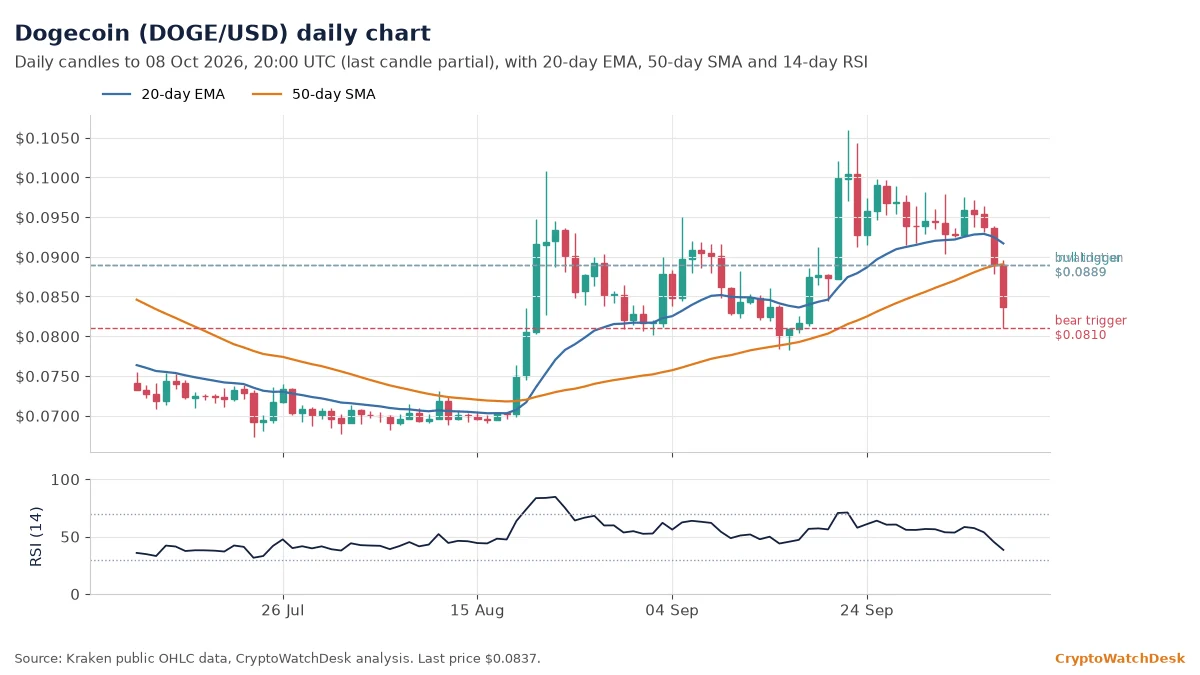
DOGE traded near $0.0837, below its 20-day EMA at $0.0925, its 50-day SMA at $0.0889 and its 200-day SMA at $0.0878. The RSI reads 45.6.
If buyers push and hold above $0.0889, the price could climb toward $0.0925. A daily close below $0.0810, Thursday’s low, would open the way to $0.0783, the 30-day low. The bearish reading is invalidated by a daily close back above $0.0889.
DOGE’s 24-hour range was $0.0810 to $0.0896, about 11%. It now trades about 21% below its 30-day high of $0.1059 and about 7% above its 30-day low.
Cardano price analysis
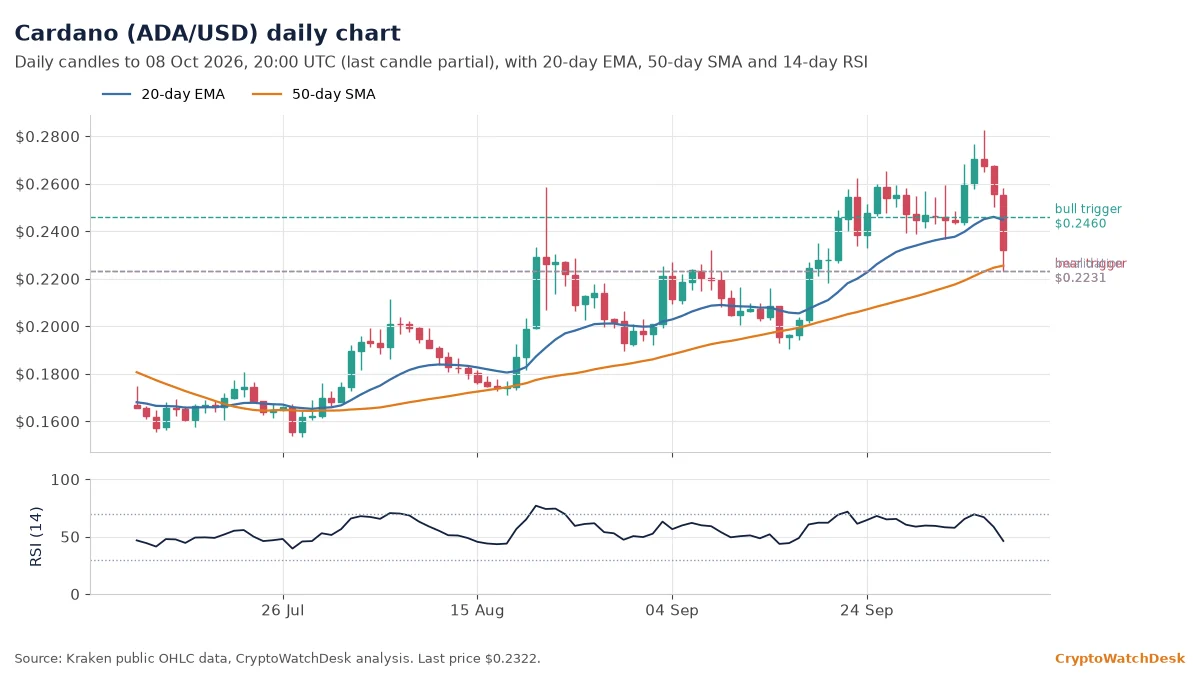
ADA traded near $0.2322, down 9.2% on the day, below its 20-day EMA at $0.2460 and about 3% above its 50-day SMA at $0.2246. The RSI reads 58.6, still the highest in the group after its September run.
Related: Coin Levels 7 Oct
If buyers push and hold above $0.2460, the price could climb toward $0.2581, Thursday’s high. A daily close below $0.2231 would open the way to $0.2131, the 200-day SMA. The breakout is invalidated below $0.2231.
ADA’s 24-hour range was the widest in the group, from $0.2231 to $0.2581, about 16%. It is about 18% below its 30-day high of $0.2825.
Yesterday’s levels: how they held: Wednesday’s map set a daily close below $82,700 as bitcoin’s bearish trigger; Wednesday closed at $83,276, so the trigger did not fire, yet price still reached the $80,000 area the bearish branch pointed to, on Thursday, without a close beneath it.
Technical levels are probabilistic and are often wrong. Do your own research; never trade with money you can’t afford to lose.
Produced by the Crypto Watch Desk newsroom using AI tools. This article is for information only and is not investment advice.