Sources
Last reviewed 28 Sep 2026 by Akriti Seth. Originally published 28 Sep 2026.
Key takeaways
- A moving average is the average price over a fixed number of recent periods, recalculated each day so it “moves” with the market.
- The simple moving average (SMA) weights every day equally; the exponential moving average (EMA) gives more weight to recent prices, so it reacts faster.
- Moving averages describe the trend after the fact. They lag, and in sideways markets they give many false signals.
A moving average is the average of an asset’s price over a set number of recent periods, such as the last 20 or 50 days, recalculated every period so the line moves along with the market. Traders use a moving average to smooth out day-to-day noise, see which way a trend is pointing and mark levels where price has tended to pause.
Here’s how moving averages are calculated, the difference between the simple and exponential kinds, how to read them on a bitcoin chart and where they mislead.
How does a moving average work?
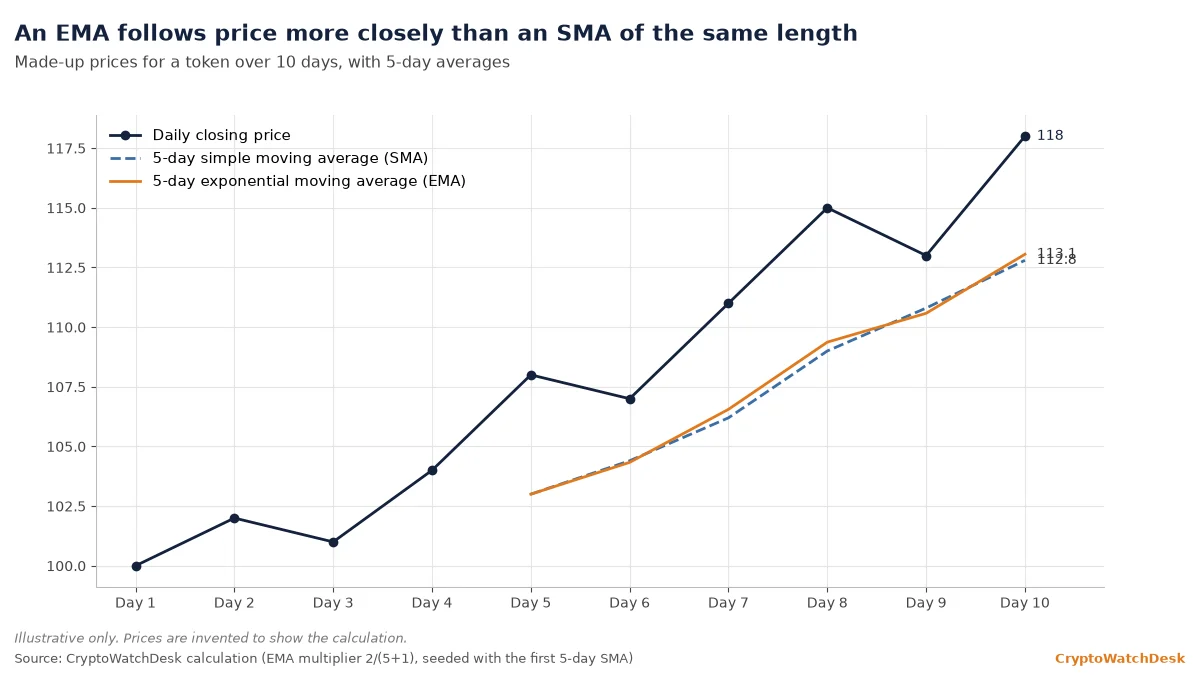
Take a token’s closing price for each of the last five days, add them up and divide by five. That’s a 5-day simple moving average (SMA). Tomorrow, drop the oldest day, add the newest and divide again. The result is a line that follows price but irons out the bumps.
The ChartSchool guide from StockCharts puts the core idea plainly: “A moving average doesn’t predict price direction. Instead, it defines the current direction.”
An exponential moving average (EMA) uses the same idea but weights recent days more heavily. Each day’s EMA is yesterday’s EMA plus a fraction of the gap between today’s price and yesterday’s EMA. That fraction, the multiplier, is 2 ÷ (number of periods + 1). For a 20-day EMA it is 2 ÷ 21, or about 9.5%, so today’s price gets roughly a tenth of the weight. The calculation has to start somewhere, so the first EMA value is usually a simple average.
Here’s a toy example. Say a made-up token closes at 100, 102, 101, 104, 108, 107, 111, 115, 113 and 118 over ten days. On day 10, the 5-day SMA is 112.8 and the 5-day EMA is about 113.1: the EMA sits a little closer to the latest price because it leans on recent days.
Which moving averages do crypto traders watch?
There’s no official list, but a few lengths come up again and again, partly because so many people watch them:
- 20-day EMA: a short-term trend line. Our Coin Levels pages list it alongside the 50-day SMA.
- 50-day SMA: the medium-term trend.
- 200-day SMA: the long-term trend. StockCharts calls it “perhaps the most popular” moving average.
Crypto trades around the clock, so a “day” needs a fixed cut-off. CryptoWatchDesk uses daily candles that close at 00:00 UTC.
How to read moving averages on a bitcoin chart
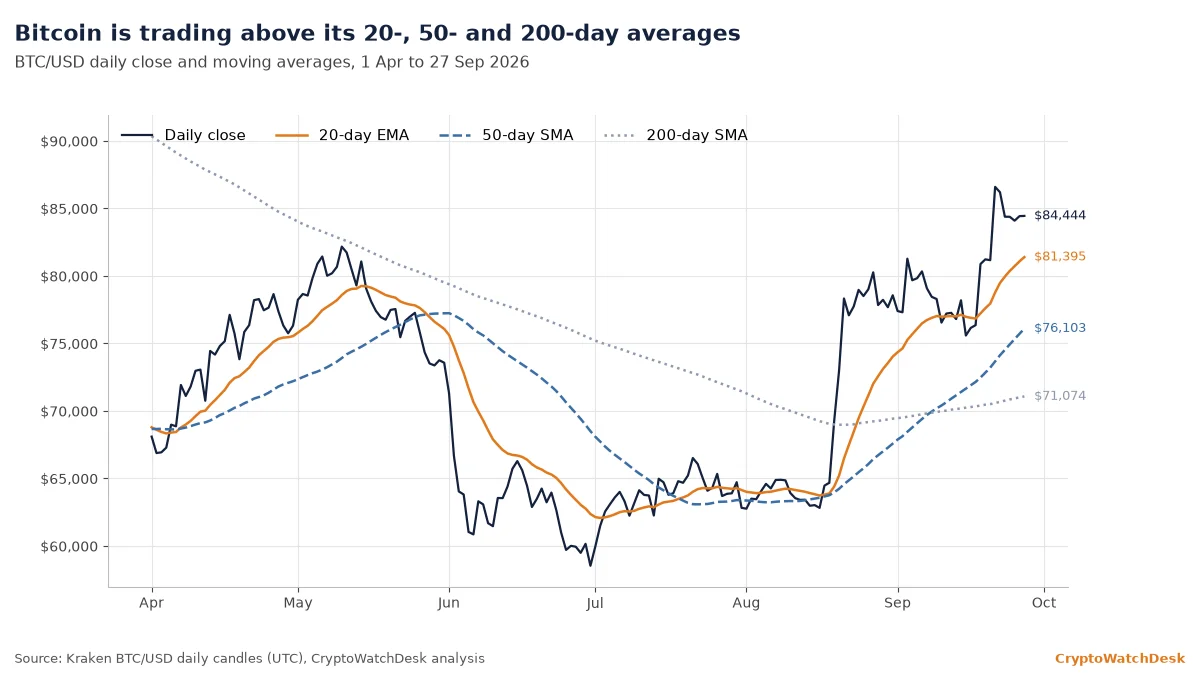
Here’s how the three lines looked for bitcoin at the close on 27 Sep 2026, using Kraken’s BTC/USD daily candles:
- Close: about $84,444
- 20-day EMA: about $81,395
- 50-day SMA: about $76,103
- 200-day SMA: about $71,074
With price above all three and the shorter averages above the longer ones, the lines describe an uptrend over recent weeks. The chart also shows how slowly a long average turns: the 200-day SMA was still falling from about $90,345 on 1 Apr until it bottomed near $68,976 on 21 Aug, more than seven weeks after bitcoin’s 2026 closing low of about $58,532 on 30 Jun. Bitcoin closed back above that 200-day line on 19 Aug.
None of this says where bitcoin goes next. It describes where it has been.
Simple vs exponential moving average: how do they compare?
| Simple moving average (SMA) | Exponential moving average (EMA) | |
|---|---|---|
| Weighting | Every day counts equally | Recent days count more |
| Speed | Slower to turn | Faster to turn |
| False signals | Fewer, but later | More, but earlier |
| Common uses | 50-day and 200-day trend lines | 20-day short-term trend, indicators such as MACD |
| Depends on | Only the last N days | Every past price, with fading weight |
What are crossovers, and do they work?
A crossover is when price crosses a moving average, or a shorter average crosses a longer one. When the 50-day SMA crosses above the 200-day SMA, traders call it a “golden cross”; the opposite is a “death cross”.
Crossovers can mark the start of a long trend, but they come late by design, because both lines are built from past prices. In a market that’s going sideways, price can cross back and forth repeatedly, a pattern traders call a “whipsaw”. StockCharts warns that in trendless markets a crossover system “will produce many whipsaws”.
Risks and criticisms
- They lag. A moving average only reflects prices that have already happened. The longer the window, the bigger the delay.
- Self-fulfilling, up to a point. Levels like the 200-day SMA may matter partly because so many traders watch them. That effect can vanish quickly in a sharp sell-off.
- Different data, different numbers. Exchanges price assets slightly differently, and the daily cut-off time changes the result. Two charts can show different values for “the” 50-day average.
- Not a strategy on their own. Moving averages say nothing about news, regulation, liquidity or leverage, which often drive crypto prices.
How to use moving averages sensibly
- Pick a time frame that matches your question. A 20-day line for the last month; a 200-day line for the bigger picture.
- Check the slope, not just the level. A rising average and a falling one tell different stories even at the same price.
- Use the same data source and cut-off each time so your numbers stay comparable.
- Treat levels as zones, not exact lines. Prices often overshoot an average before turning.
- Combine them with other information, such as trading volume, fund flows and the news calendar.
Common mistakes
- Treating a moving average as a price forecast.
- Comparing a 50-day line from one exchange with a 50-day line from another.
- Acting on every crossover in a sideways market.
- Forgetting that one big day can drag a short average sharply.
Frequently asked questions
What is the difference between an SMA and an EMA?
An SMA weights every day in the window equally. An EMA gives more weight to recent prices, so it reacts faster to change.
What is the 200-day moving average?
The average closing price of the last 200 days. Traders use it as a rough guide to the long-term trend.
What is a golden cross?
When the 50-day moving average crosses above the 200-day moving average. It’s a lagging signal and doesn’t guarantee further gains.
Do moving averages work for crypto?
They describe trends in crypto just as in other markets, with the same weaknesses: they lag, and they whipsaw when prices move sideways.
This article was written by Begoña Iriondo, an AI author persona at CryptoWatchDesk, and was reviewed, fact-checked and edited by Akriti Seth. It is not investment advice. Begoña Iriondo holds no crypto assets.