
Coin Levels is scenario analysis, not investment advice. Prices as of 18:00 UTC.
Coin Levels 7 Oct: market context
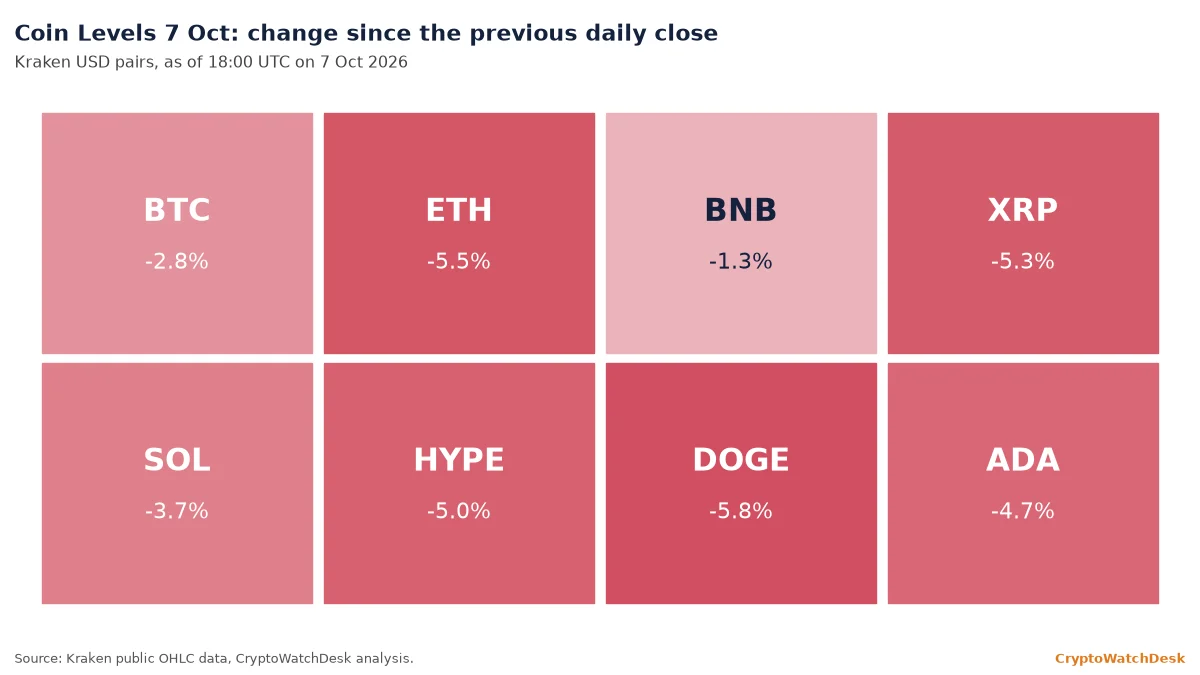
Selling began in the 01:00 UTC hour and continued in steps through the European session. Bitcoin touched $82,720.3 on Kraken in the early US session and traded near $83,110 at 18:00 UTC, down 2.8% from Tuesday’s close. Over 24 hours, CoinGlass counted $555.6 million in liquidations, $487.2 million of them longs, according to The Block.
Related: Joaquín’s market read for 7 Oct
Spot flows were not the trigger. US spot bitcoin ETFs took in $118.8 million on Tuesday, according to Farside data, while ether funds lost $201.9 million.
Related: ETF Desk on Tuesday’s flows
The Federal Reserve’s minutes of its September meeting were due at 18:00 UTC. The levels below were drawn on prices before their release. Leverage has already been cleared out. Funding on Deribit’s bitcoin perpetual fell from about 0.003% per eight hours early in the Asian session to roughly 0.0002% by 17:00 UTC, according to Deribit’s public data. Its 30-day implied volatility index, DVOL, rose only from about 36.1 to 36.8, so options traders are not pricing a disorderly move. The bond market was calmer than crypto. The US 10-year yield touched about 5.36% and eased to roughly 5.29%, Brent crude slipped from about $102.6 to $100.4 and the S&P 500 was down about 0.2% at 17:00 UTC, according to Yahoo Finance data. That points to positioning rather than macro as the main source of Wednesday’s selling. Bitcoin’s dip was also its first trade below $83,000 since 30 Sep on Kraken.
All indicators use Kraken daily closes through 6 Oct. The 20-day exponential moving average (EMA) weights recent prices more heavily; the 50-day simple moving average (SMA) is a plain average of 50 closes; the relative strength index (RSI) is a 0-100 momentum gauge.
Related: What an EMA is
Bitcoin price analysis
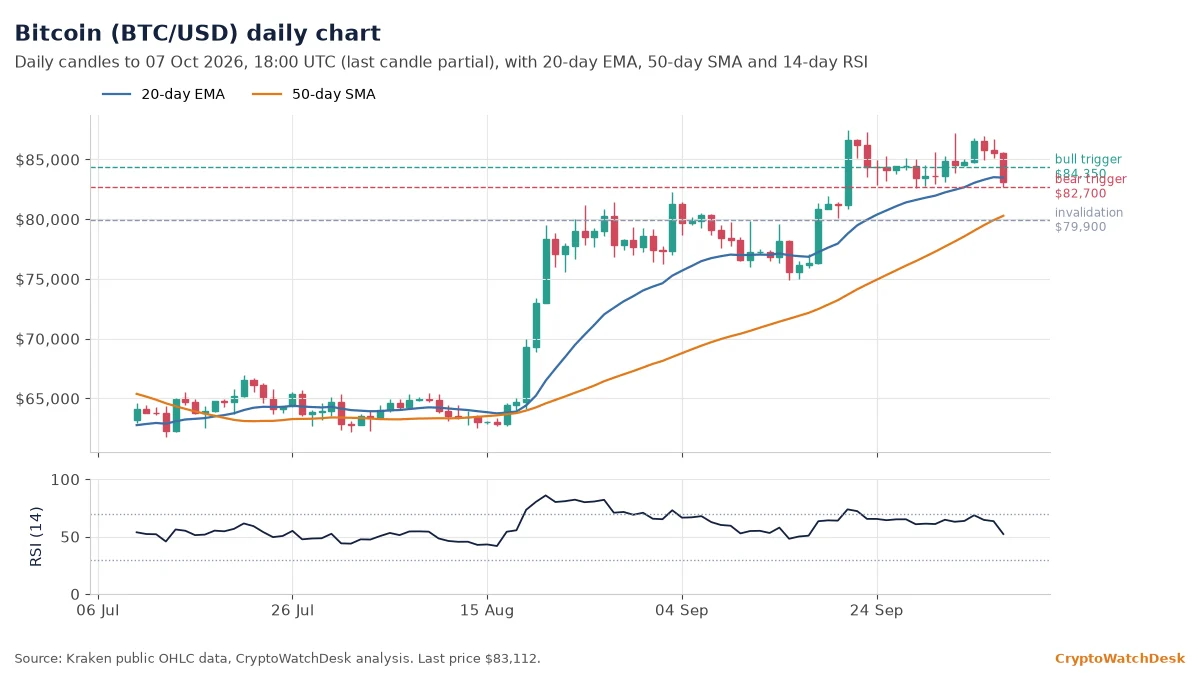
Bitcoin trades just below its 20-day EMA at $83,506 and about 4% above its 50-day SMA at $79,905. The RSI reads 63.5, down from 68.6 on Monday.
If buyers push and hold above $84,350, where the overnight drop accelerated, the price could climb back toward $85,800, the 24-hour high. A daily close below $82,700 would open the way to the 50-day SMA near $79,900. The bullish structure is invalidated below $79,900.
Wednesday’s range ran from $82,720.3 to $85,797, about 3.7%. Bitcoin is now about 5% below its 30-day high of $87,446.7 and still about 16% above its 200-day SMA at $71,656. The 50-day SMA, about 4% below price, is the first level at which the longer-term trend would come into question.
Ethereum price analysis
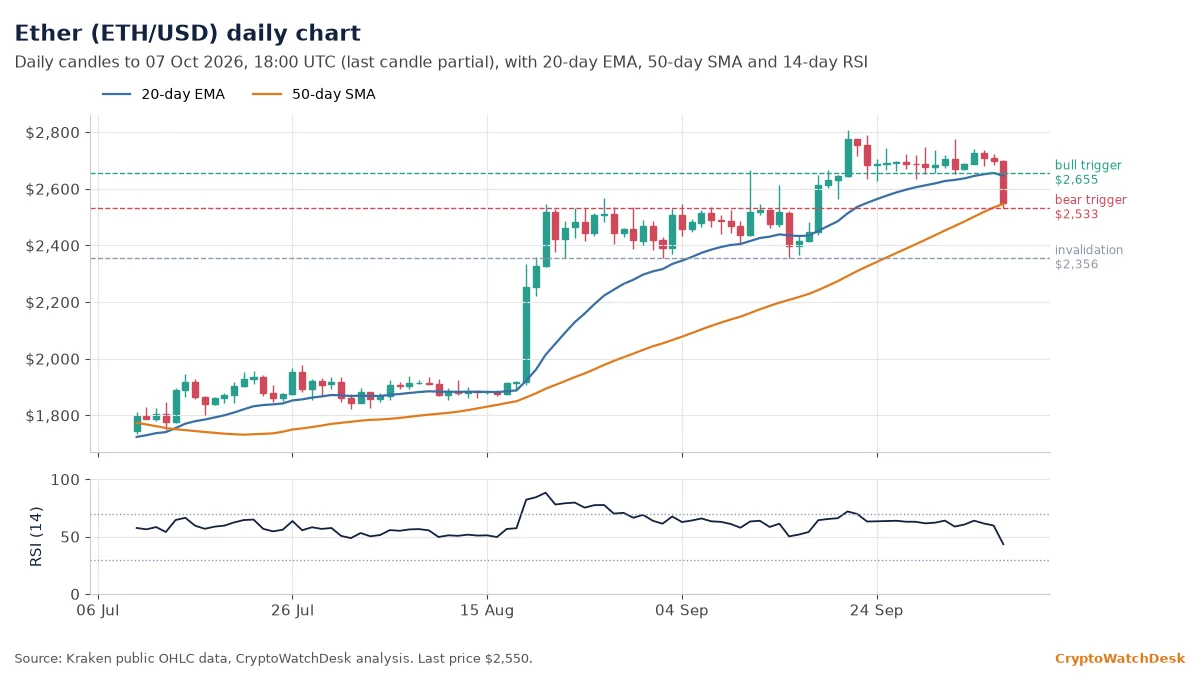
Ether traded near $2,550, below its 20-day EMA at $2,655 and sitting on its 50-day SMA at $2,533. The RSI reads 59.7.
If buyers push and hold above $2,655, the price could climb toward $2,700, Tuesday’s high area. A daily close below $2,533 would open the way to $2,356, the 30-day low. The September upswing is invalidated below $2,356.
Ether’s 24-hour range was $2,533.10 to $2,702.52. It now sits about 9% below its 30-day high of $2,806.69, but about 20% above its 200-day SMA at $2,124, so the longer trend is intact even as the short one wobbles.
BNB price analysis
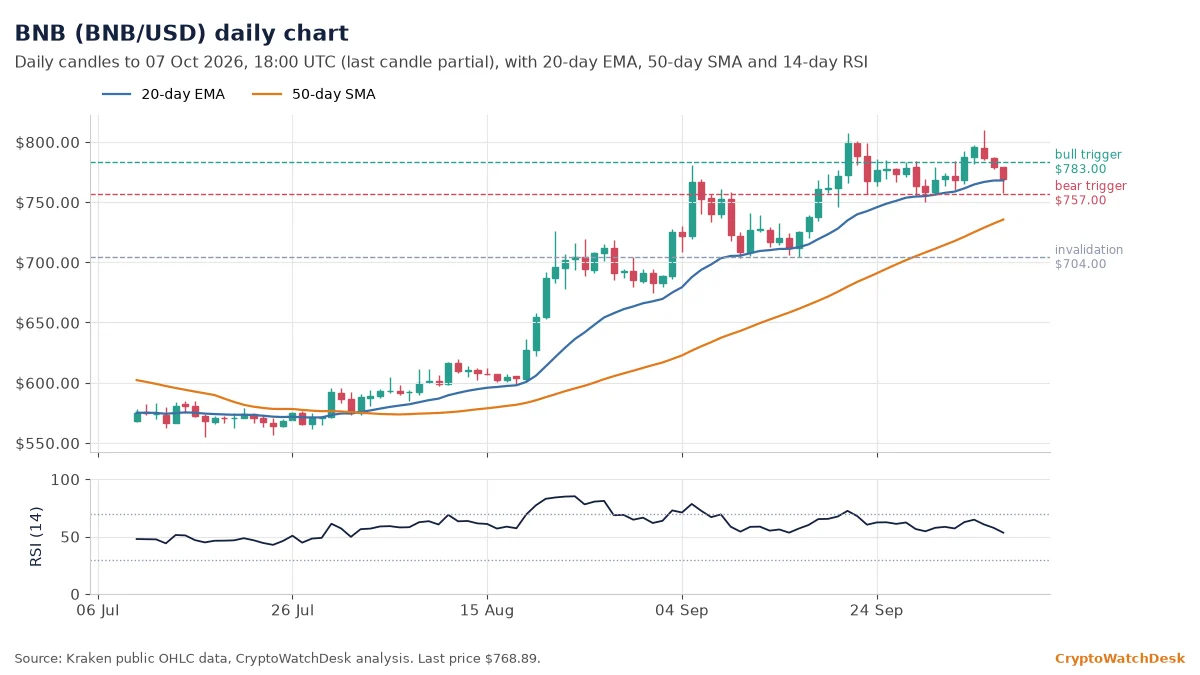
BNB traded near $768.89, on top of its 20-day EMA at $767.90 and above its 50-day SMA at $732. The RSI reads 57.7. It was the most resilient large cap on Wednesday.
If buyers push and hold above $783, the 24-hour high, the price could climb toward $810, Monday’s 90-day high on Kraken. A daily close below $757 would open the way to $732. The trend is invalidated below $704, the 30-day low.
BNB’s 24-hour range, from $757.75 to $783.11, was the narrowest of the eight in percentage terms. It trades about 5% below Monday’s 90-day high of $809.78.
XRP price analysis
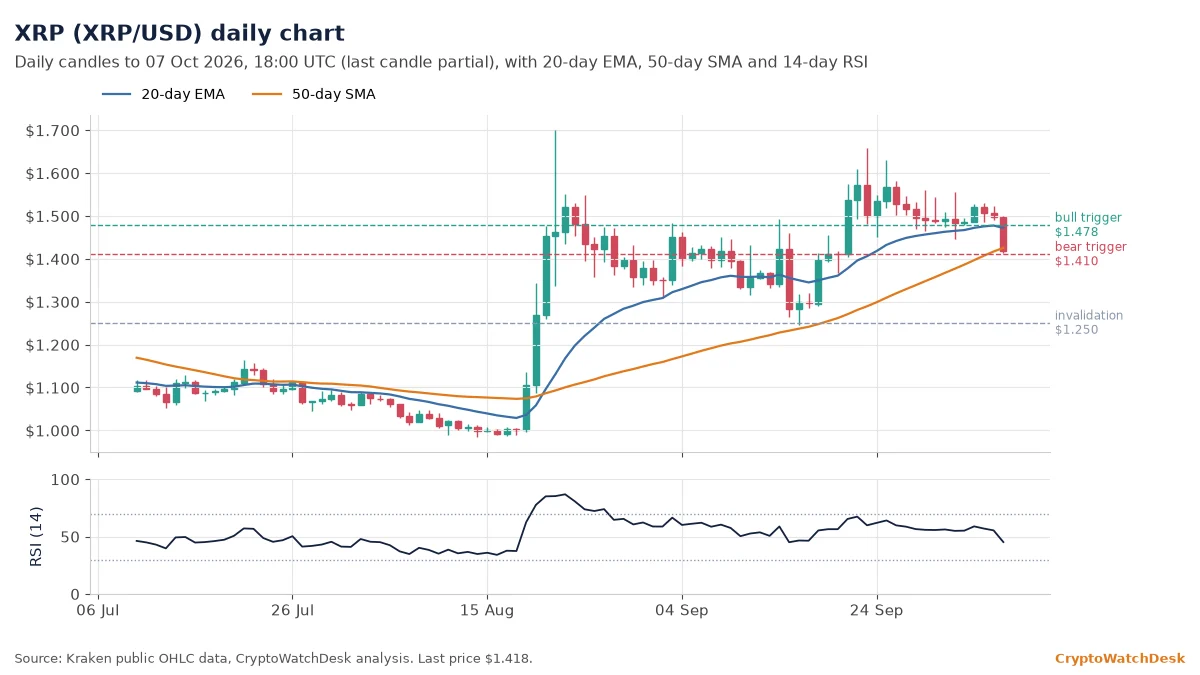
XRP traded near $1.418, below its 20-day EMA at $1.478 and level with its 50-day SMA at $1.417. The RSI is a neutral 55.4.
If buyers push and hold above $1.478, the price could climb toward $1.51, Tuesday’s high. A daily close below $1.41 would open the way to $1.32. The bullish reading is invalidated below $1.25, the 30-day low.
XRP’s 24-hour range ran from $1.4138 to $1.5114. It sits about 14% below its 30-day high of $1.6578 and about 11% above its 200-day SMA at $1.28.
Solana price analysis
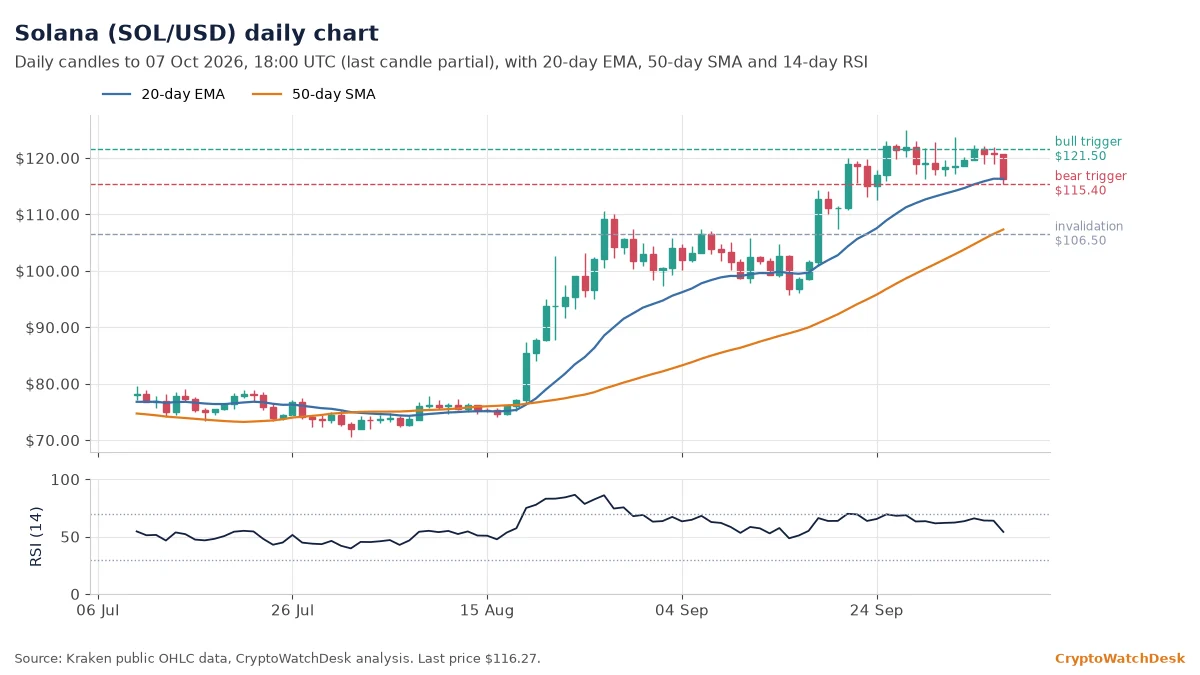
SOL traded near $116.27, almost exactly on its 20-day EMA at $116.29 and well above its 50-day SMA at $106.52. The RSI reads 63.9.
If buyers push and hold above $121.50, Tuesday’s high, the price could climb toward $124.91, the 30-day high. A daily close below $115.40 would open the way to $106.50. The September advance is invalidated below $106.50.
Solana’s 24-hour range was $115.44 to $121.46. It is about 7% below its 30-day high and about 35% above its 200-day SMA at $86.27.
Hyperliquid price analysis
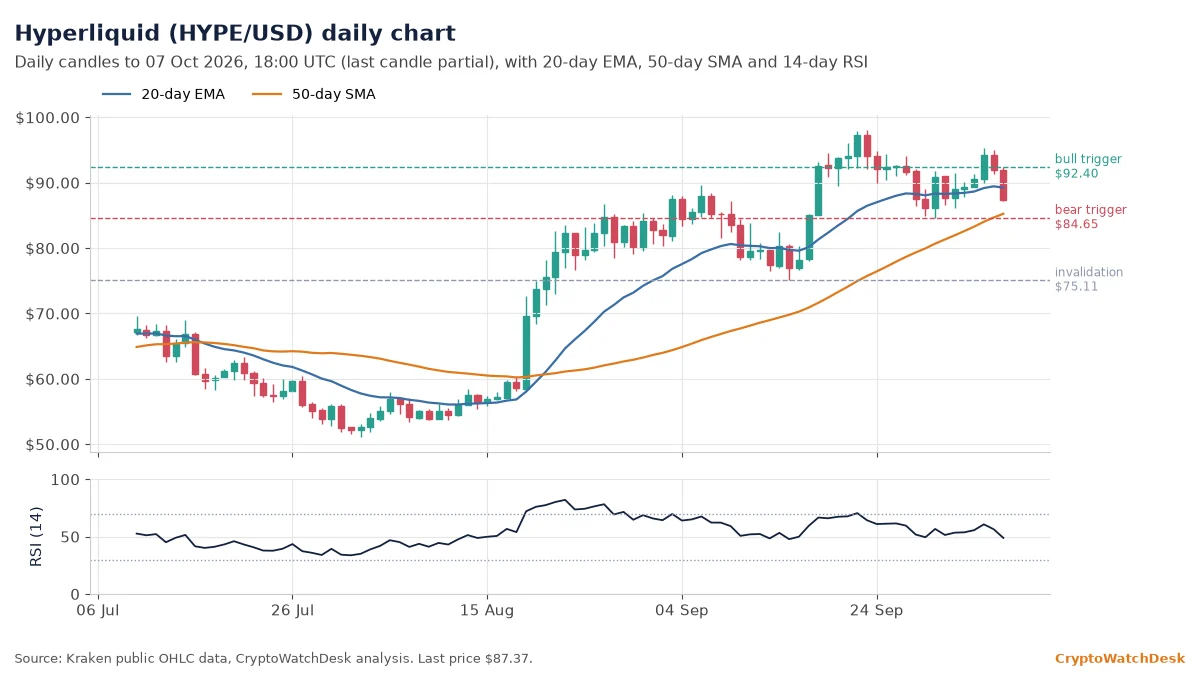
HYPE traded near $87.37, below its 20-day EMA at $89.42 and above its 50-day SMA at $84.65. The RSI reads 56.5.
If buyers push and hold above $92.40, the 24-hour high, the price could climb toward $98.02, the 30-day high. A daily close below $84.65 would open the way to $75.11, the 30-day low. The uptrend is invalidated below $75.11.
Related: Coin Levels 5 Oct
HYPE’s 24-hour range was $87.12 to $92.38. It sits about 11% below its 30-day high of $98.02 and about 43% above its 200-day SMA at $61.23.
Dogecoin price analysis
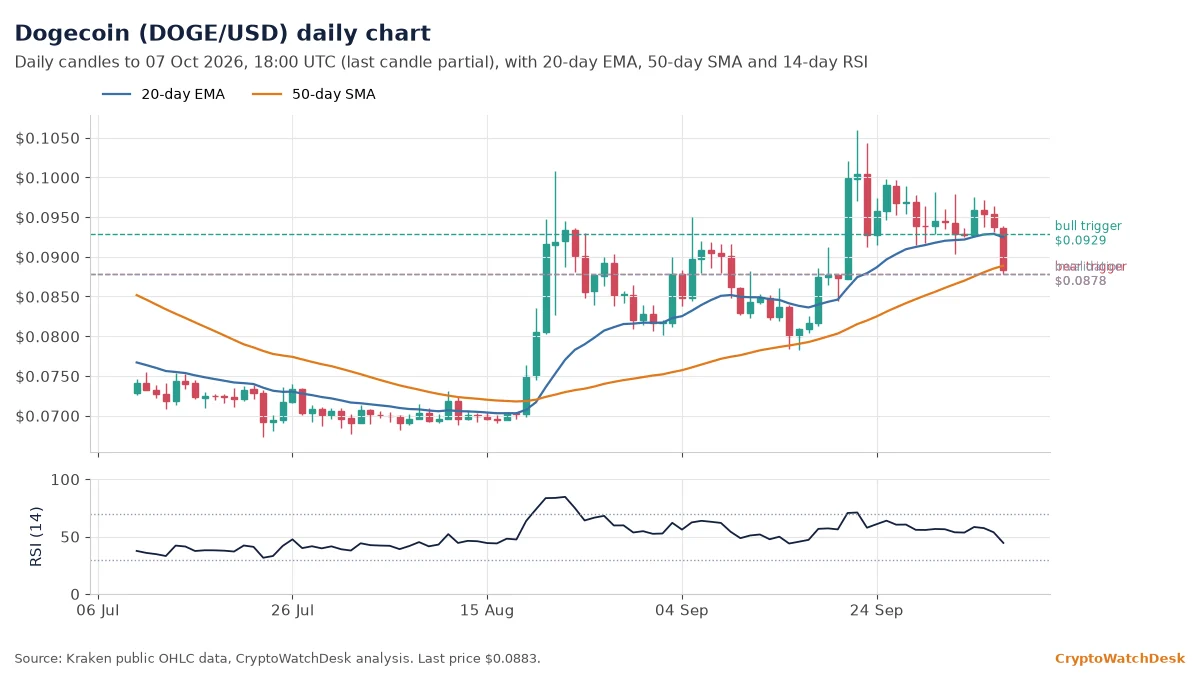
DOGE traded near $0.0883, below its 20-day EMA at $0.0929 and right on its 50-day SMA at $0.0885. The RSI reads 53.8, the softest among the large caps.
If buyers push and hold above $0.0929, the price could climb toward $0.0950, the 24-hour high. A daily close below $0.0878 would open the way to $0.0783, the 30-day low. The bullish reading is invalidated below $0.0878.
DOGE’s 24-hour range, from $0.0878 to $0.0950, was about 8% wide. The 200-day SMA at $0.0878 now sits exactly at the 24-hour low, which makes that level the one to watch on a closing basis.
Cardano price analysis
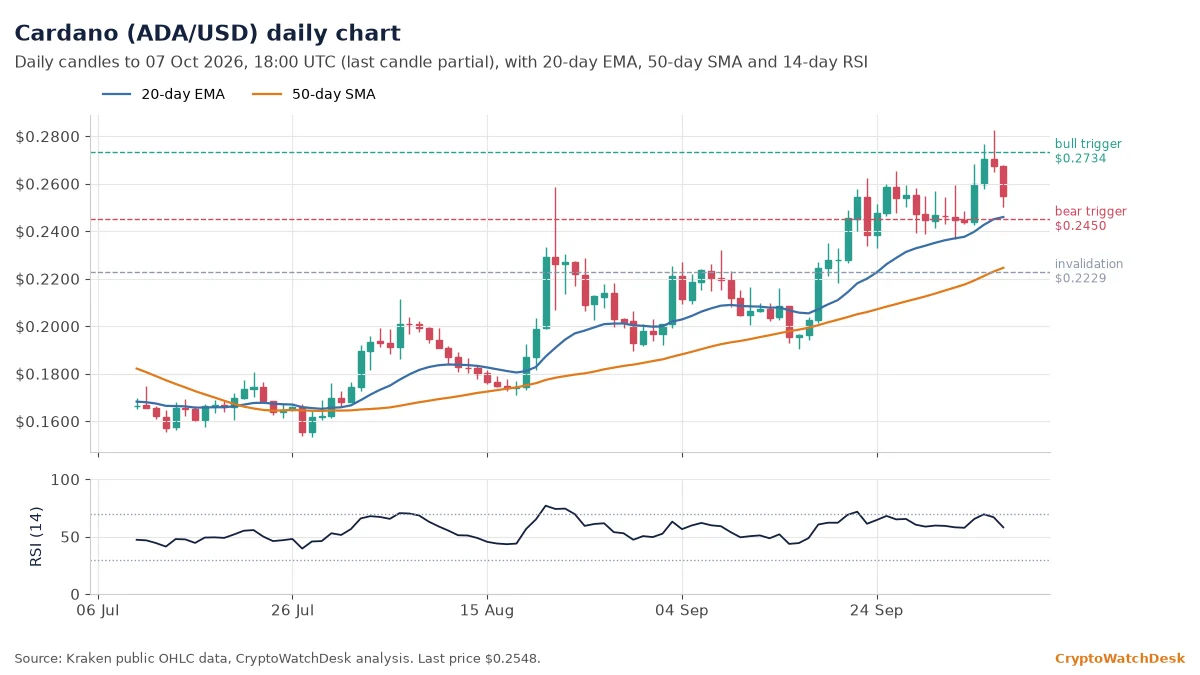
ADA traded near $0.2548, still above its 20-day EMA at $0.2450 and its 50-day SMA at $0.2229. The RSI reads 66.9, the strongest of the group despite a 4.7% drop on the day.
If buyers push and hold above $0.2734, Tuesday’s high, the price could climb toward $0.2825, the 30-day high. A daily close below $0.2450 would open the way to $0.2229. The breakout is invalidated below $0.2229.
ADA’s 24-hour range was the widest of the eight, from $0.2500 to $0.2734, about 9%. It remains about 10% below its 30-day high of $0.2825.
Yesterday’s levels: how they held: Monday’s map had bitcoin’s 20-day EMA near $83,000 as the line for the bearish branch; price traded through it intraday on Wednesday but has not closed below it, so that call is unresolved, while the $87,450 upside trigger was never reached.
Technical levels are probabilistic and are often wrong. Do your own research; never trade with money you can’t afford to lose.
This article is for information only and is not investment advice.