
Coin Levels is scenario analysis, not investment advice. Prices as of 19:00 UTC.
Coin Levels 5 Oct: market context
Bitcoin reached $86,973.6 on Kraken shortly after midnight UTC and then slipped to $84,965.7 as the US 10-year Treasury yield pushed toward 5.35%. It recovered to about $85,650 by 19:00 UTC. The two-week range between roughly $83,000 and $87,000 is intact.
Related: Joaquín’s market read for 5 Oct
Flows were supportive into the weekend. US spot bitcoin ETFs took in $189.9 million on Friday, 2 Oct, according to Farside data. Monday’s totals were not final at the time of writing. ETF Desk Corporate demand was steady too. Strategy disclosed in a Form 8-K filing on Monday that it bought 334 BTC between 1 and 4 Oct, taking its holdings to 848,000 BTC.
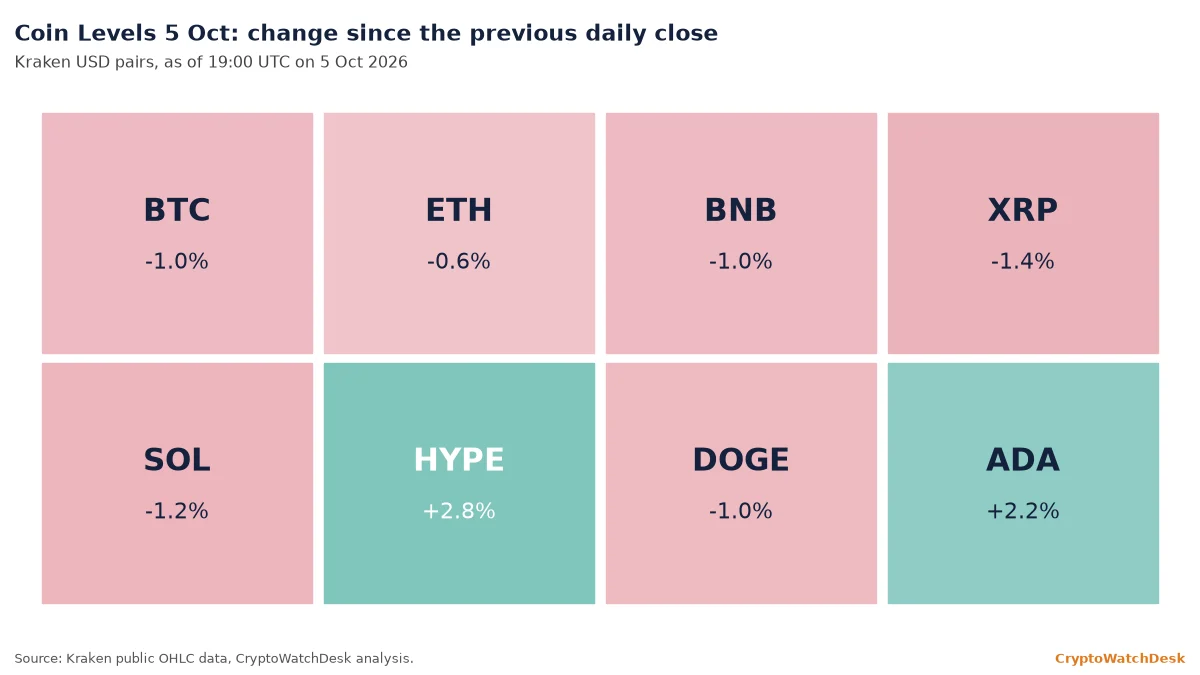
Derivatives give little directional signal. Funding on Deribit’s bitcoin perpetual stayed close to zero, and Deribit’s 30-day implied volatility index, DVOL, held near 36, according to Deribit’s public data. The macro backdrop is the variable to watch. The US 10-year Treasury yield rose to about 5.35% in the New York afternoon and the dollar index touched 102.5, while Brent crude eased from about $102 to $100. If yields keep climbing, risk assets such as crypto would face continued pressure; a retreat would ease it. The levels below are drawn on price alone and do not assume either outcome, so a sharp macro move could make any of them stale quickly.
All indicators below use Kraken daily closes through 4 Oct. The 20-day exponential moving average (EMA) weights recent prices more heavily; the 50-day simple moving average (SMA) is a plain average of 50 closes; the relative strength index (RSI) is a 0-100 momentum gauge.
Related: What an EMA is
Bitcoin price analysis
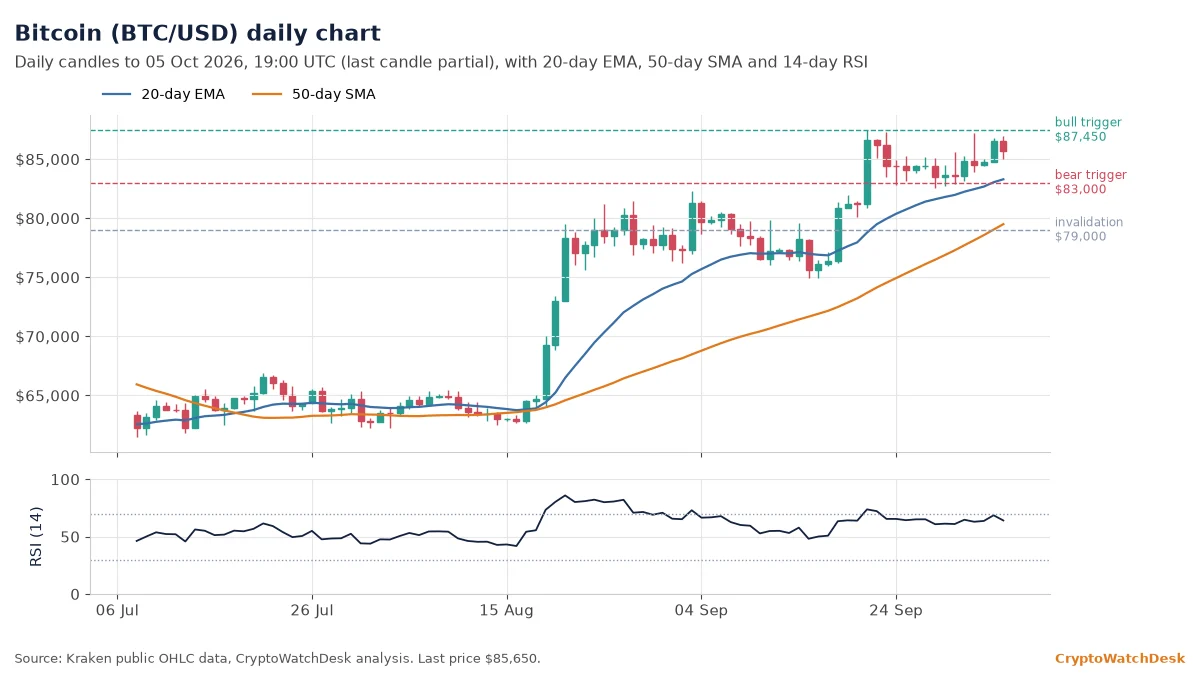
Bitcoin trades above its 20-day EMA at $83,032 and its 50-day SMA at $79,025. The daily RSI reads 68.6, close to the 70 line that many traders treat as stretched.
If buyers push and hold above $87,450, the 30-day high, the price could climb toward $90,000. A daily close below the 20-day EMA near $83,000 would open the way to the 50-day SMA near $79,000. The bullish structure is invalidated on a daily close below $79,000.
Monday’s range of about $2,000, from $84,965.7 to $86,973.6, was narrow for a test of the range ceiling. The price sits about 2% below the 30-day high and roughly 20% above the 200-day SMA at $71,502.
Ethereum price analysis
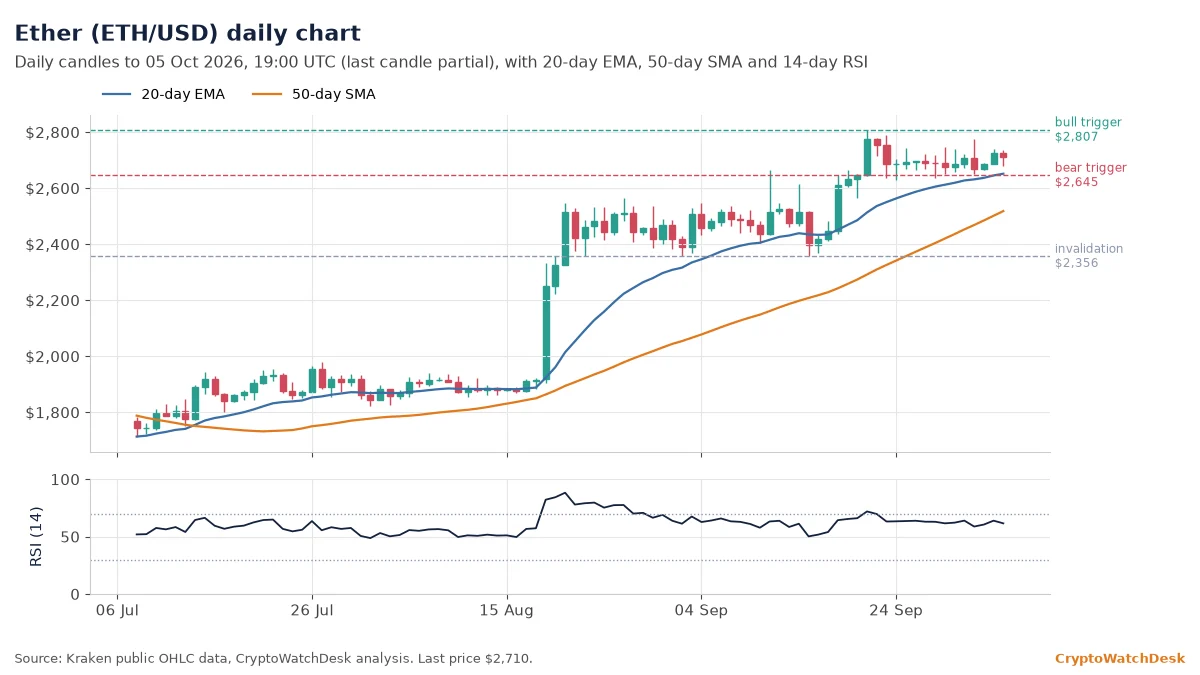
Ether traded near $2,710, above its 20-day EMA at $2,645 and its 50-day SMA at $2,501. The RSI sits at 63.9.
If buyers push and hold above $2,807, the 30-day high, the price could climb toward $2,900. A daily close below $2,645 would open the way to $2,500. The upswing from September is invalidated below $2,356, the 30-day low.
Ether’s 24-hour range was tight, from $2,678.88 to $2,738.82. It trades about 3.4% below its 30-day high and roughly 28% above its 200-day SMA at $2,118, so the medium-term trend remains up even though the short-term push has stalled.
BNB price analysis
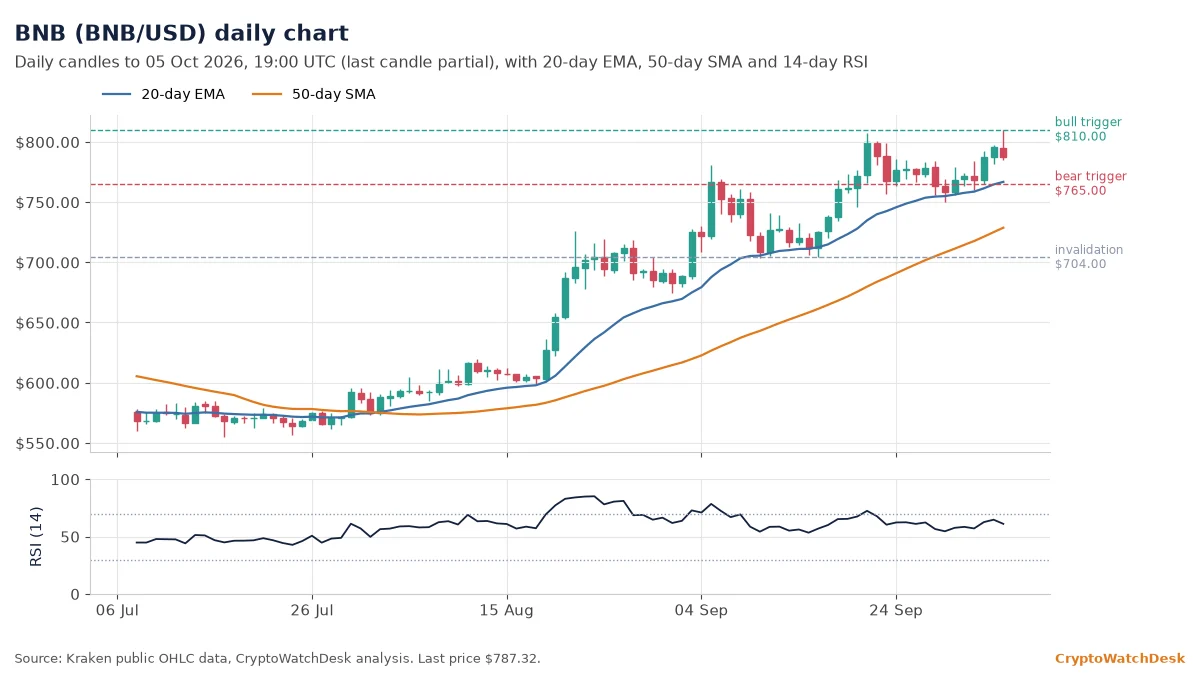
BNB printed $809.78 on Monday, above the prior 90-day high of $807.14, before easing to about $787. It holds above its 20-day EMA at $765 and its 50-day SMA at $725, with RSI at 64.8.
If buyers push and hold above $810, the price could climb toward $840. A daily close below $765 would open the way to $725. The trend is invalidated below $704, the 30-day low.
The 24-hour range ran from $784.61 to $809.78, and the reversal from the new high came within hours. BNB sits about 23% above its 200-day SMA at $638, a sign of how far the September advance has stretched.
XRP price analysis
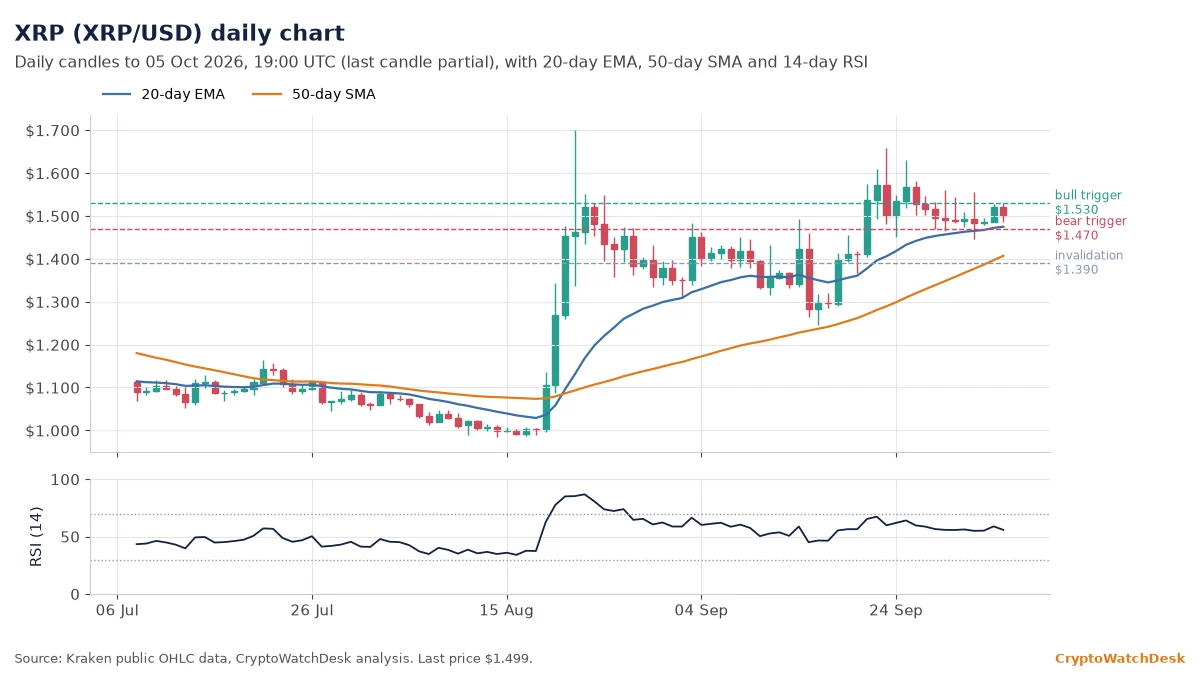
XRP traded near $1.50, only about 2% above its 20-day EMA at $1.472. The 50-day SMA sits at $1.397 and the RSI at 58.9, the weakest momentum reading among the large caps.
If buyers push and hold above $1.53, Monday’s high area, the price could climb toward the 30-day high at $1.658. A daily close below $1.47 would open the way to $1.40. The bullish reading is invalidated below $1.39.
XRP’s 24-hour range was $1.4863 to $1.5309. It is about 10% below its 30-day high of $1.6578, one of the larger gaps to that high among the assets covered here.
Solana price analysis
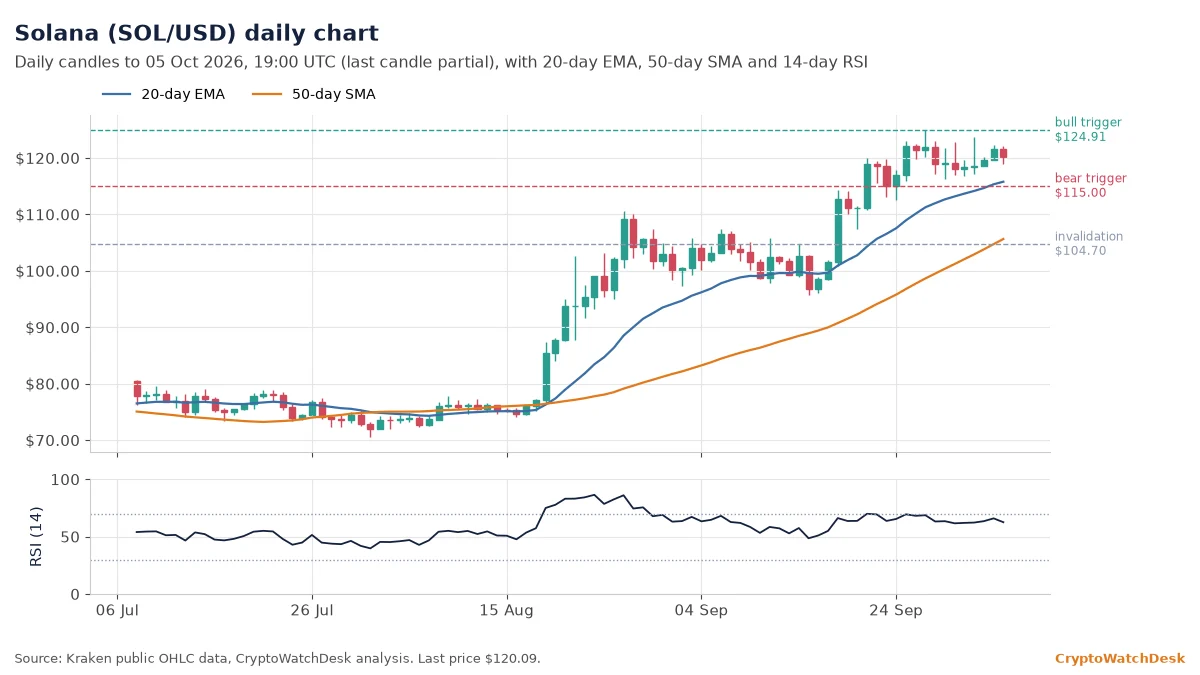
SOL traded near $120.10, above its 20-day EMA at $115.31 and its 50-day SMA at $104.70. The RSI reads 65.9.
If buyers push and hold above $124.91, the 30-day high, the price could climb toward $132. A daily close below $115 would open the way to $105. The September advance is invalidated below $104.70.
Solana traded between $118.93 and $122.25 over 24 hours. It sits about 40% above its 200-day SMA at $85.95, the result of a September run that started from a 30-day low of $95.73.
Hyperliquid price analysis
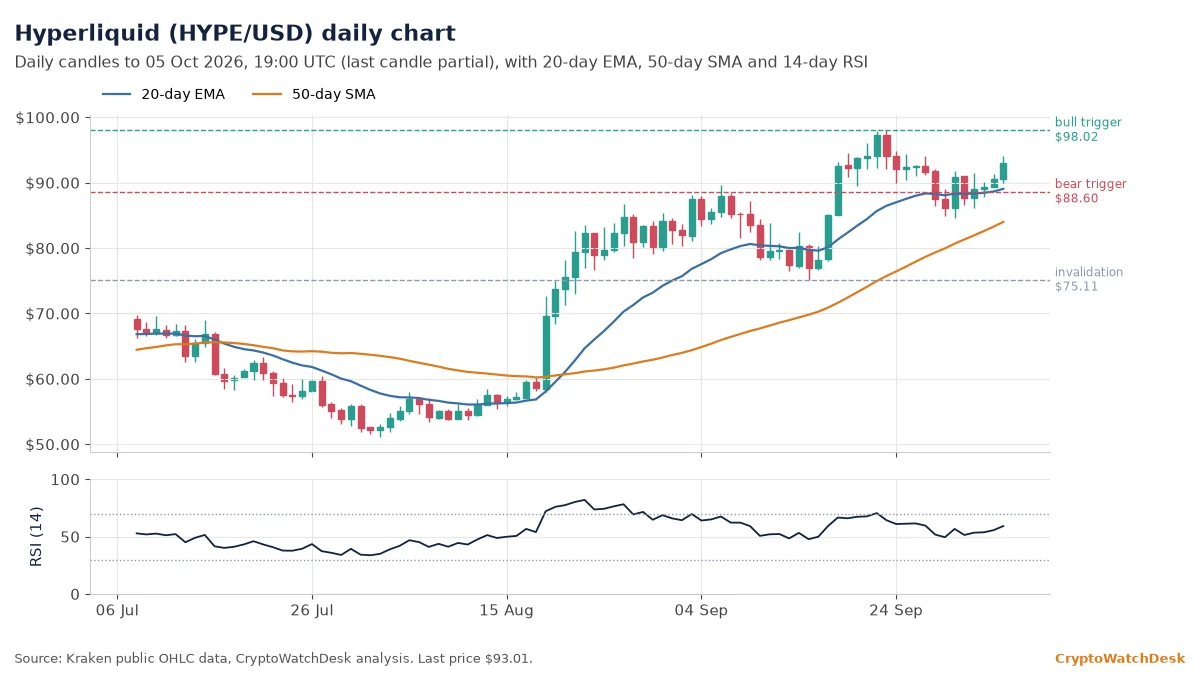
HYPE traded near $93.01, above its 20-day EMA at $88.63 and its 50-day SMA at $83.26. The RSI is a neutral 55.6.
If buyers push and hold above $98.02, the 30-day high, the price could climb toward $105. A daily close below $88.60 would open the way to $83. The uptrend is invalidated below $75.11, the 30-day low.
HYPE’s 24-hour range was $90.00 to $93.99. It sits about 5% below its 30-day high and about 53% above its 200-day SMA at $60.69, the largest premium to that average among the eight assets.
Dogecoin price analysis
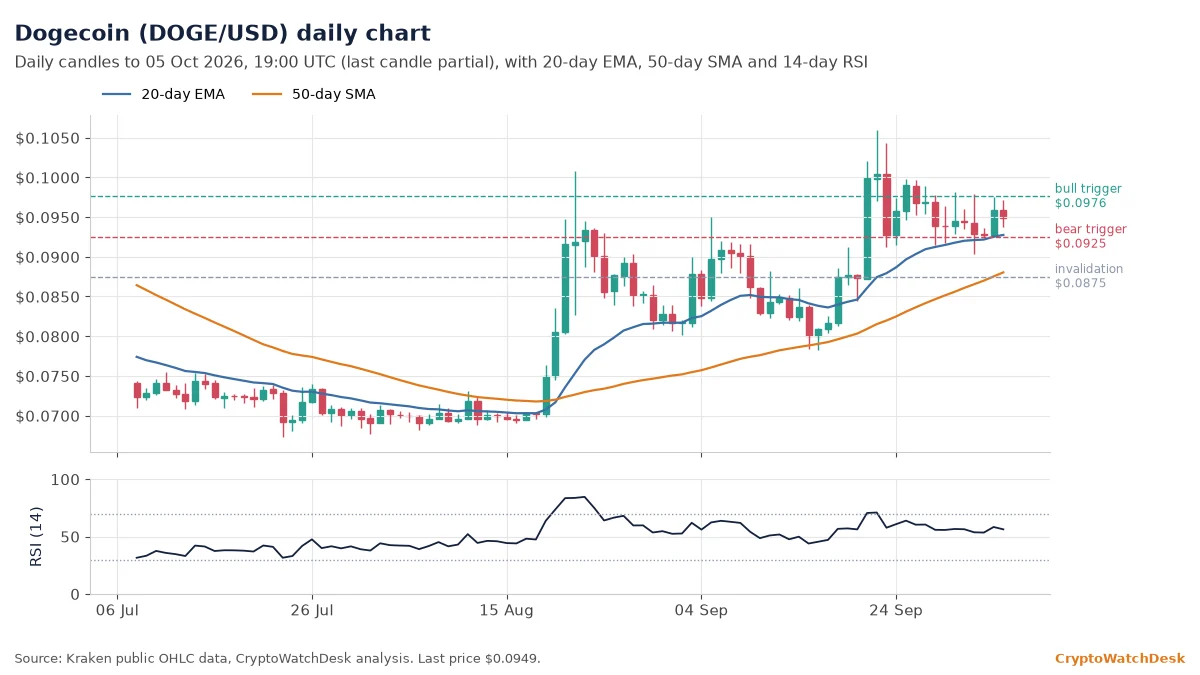
DOGE traded near $0.0949, a little above its 20-day EMA at $0.0925. The 50-day SMA sits at $0.0875 and the RSI at 58.4.
If buyers push and hold above $0.0976, Monday’s high, the price could climb toward $0.1059, the 30-day high. A daily close below $0.0925 would open the way to $0.0875. The bullish reading is invalidated below $0.0875.
DOGE ranged from $0.0938 to $0.0976 over 24 hours. It is about 10% below its 30-day high and only about 8% above its 200-day SMA at $0.0878, the thinnest long-term cushion in the group.
Cardano price analysis
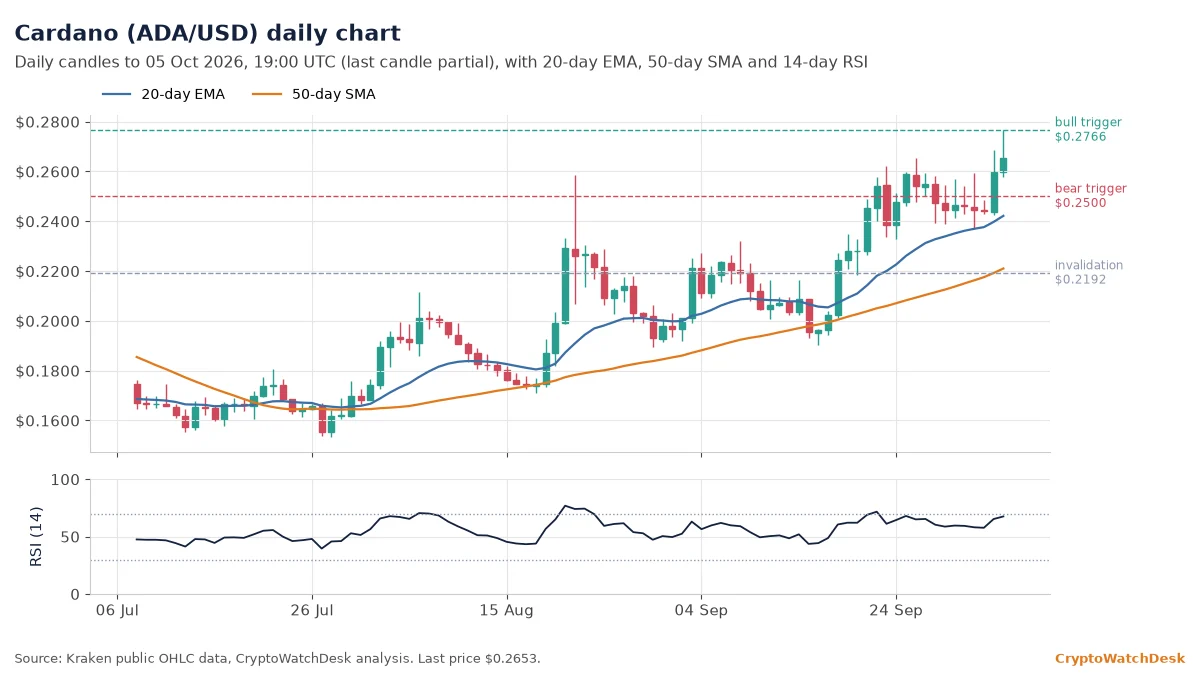
ADA reached $0.2766 on Monday, a 90-day high on Kraken, and traded near $0.2653 at 19:00 UTC. That is about 11% above its 20-day EMA at $0.2397. The RSI reads 65.3.
If buyers push and hold above $0.2766, the price could climb toward $0.29. A daily close below $0.25 would open the way to the 20-day EMA near $0.24. The breakout is invalidated below $0.2192, the 50-day SMA.
ADA’s 24-hour range was wide, from $0.2496 to $0.2766, a swing of about 11%. With price about 11% above the 20-day EMA, there is room for a pullback that would not, on its own, break the short-term trend.
Yesterday’s levels: how they held: The $87,000 ceiling flagged in last week’s maps held again; Monday’s high stopped at $86,973.6, and the $84,700 weekend base was not tested on a closing basis as of 19:00 UTC.
Technical levels are probabilistic and are often wrong. Do your own research; never trade with money you can’t afford to lose.
This article is for information only and is not investment advice.