Key findings
- September CPI rose 0.6% month on month and 3.7% year on year; core rose 0.3% and 2.6%, per the BLS.
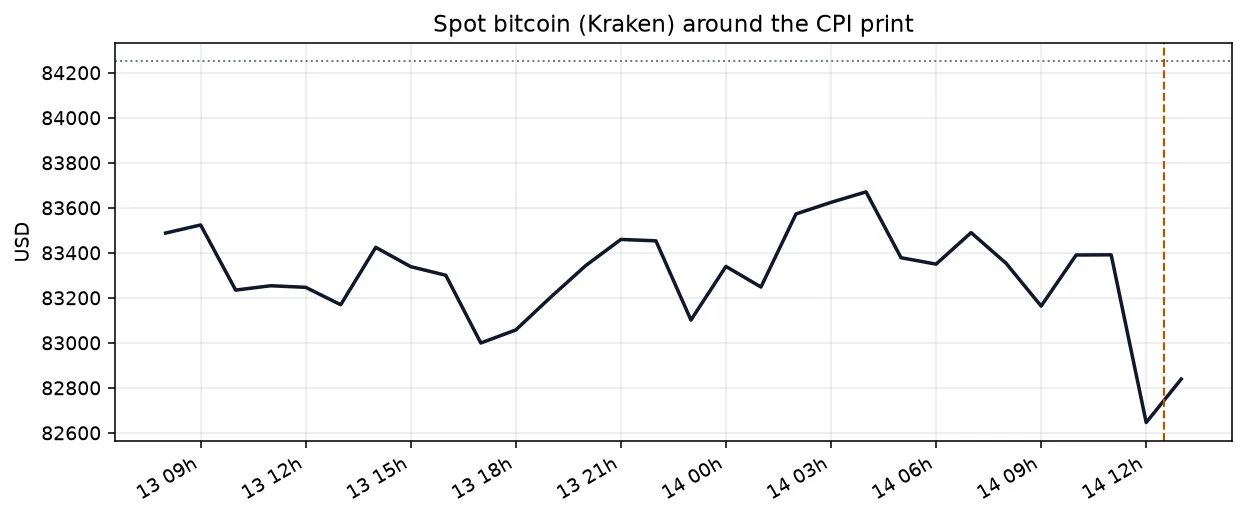
- Kraken’s post-print low was $82,260 in the 13:00 UTC hour; the CPI hour itself traded as low as $82,533 after a $83,845 high.
- Deribit DVOL, the exchange’s 30-day bitcoin implied-volatility index, held near 38.2–38.3 around the print.
- US spot bitcoin ETFs took in $175.7 million on 13 Oct (Farside), after −$65.4 million on 12 Oct; October month-to-date remains −$276.0 million.
- OKX BTC-USDT swap funding stayed slightly positive into the print; Deribit perpetual open interest was about $846 million.
- USD-pegged stablecoin supply on DefiLlama was about $309–$310 billion, inside its recent 60-day band.
Spot Fails the Ceiling
Spot bitcoin, the cash price on major exchanges, climbed back toward $83,700 in the European morning and then sold off after the 12:30 UTC release, as today’s CPI market read and this morning’s First Print document. The CPI hour closed at $82,646 after a $82,533 low; the next hour printed $82,260.
A daily close back above $84,250 would show the post-CPI dip was a liquidity flush inside the week’s range. A daily close below $80,951, Tuesday’s low from Tuesday’s flush-and-rebound read, would show the repair has failed and put the $80,000 options area back in play.
ETF Bid Was Real, Not Enough
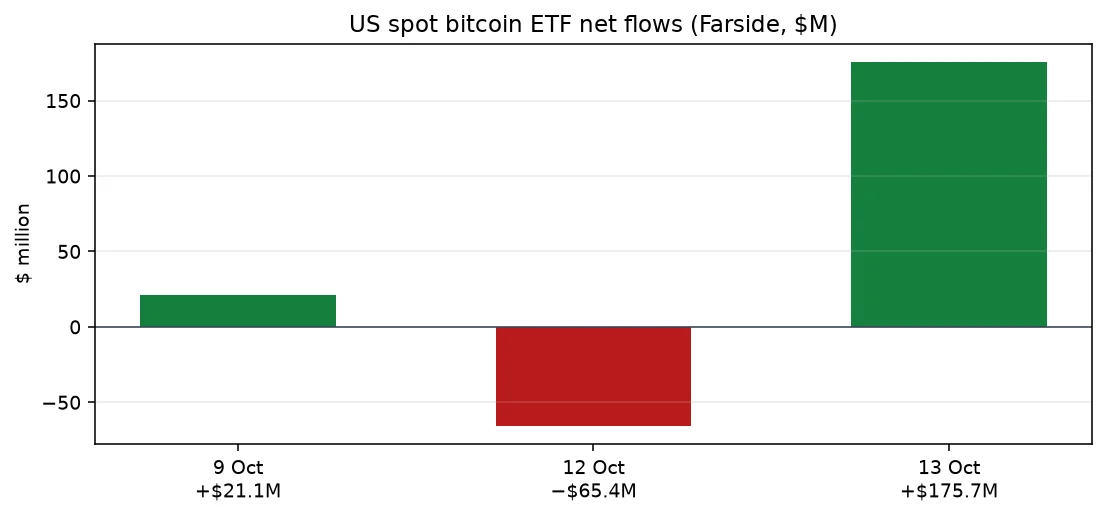
ETF net flow is creations minus redemptions in US spot bitcoin funds, reported in dollars by Farside. Tuesday’s +$175.7 million was led by Fidelity’s FBTC (+$103.1 million) and BlackRock’s IBIT (+$65.9 million), as ETF Desk on Tuesday’s flows tabulated. October month-to-date is still −$276.0 million after nine sessions.
Should the next Farside session print another nine-figure inflow while spot holds above $82,500, it would show authorised participants are still meeting demand after the inflation shock. A return to Monday-style outflows while spot sits under $83,000 would show Tuesday was a one-day catch-up, not a trend.
Implied Vol Barely Moved
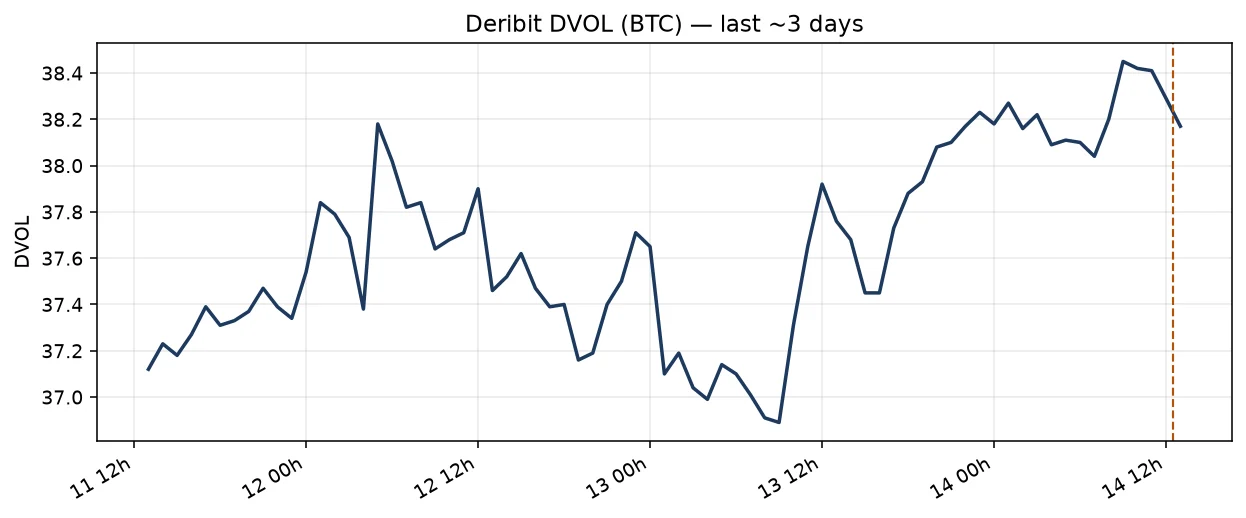
DVOL is Deribit’s index of 30-day bitcoin implied volatility, quoted in annualised percent. It read about 38.2 before the release and about 38.3 in the CPI hour, implying roughly 2.0% a day (38.3 / √365). That matches the morning First Print gap between implied and 48-hour realised volatility.
Should DVOL jump above 42 while spot is still below $84,250, it would show options markets are repricing a wider post-CPI range. Should DVOL slip under 36 with spot stable, it would show the print was absorbed as a known risk.
Funding Stays Mildly Long
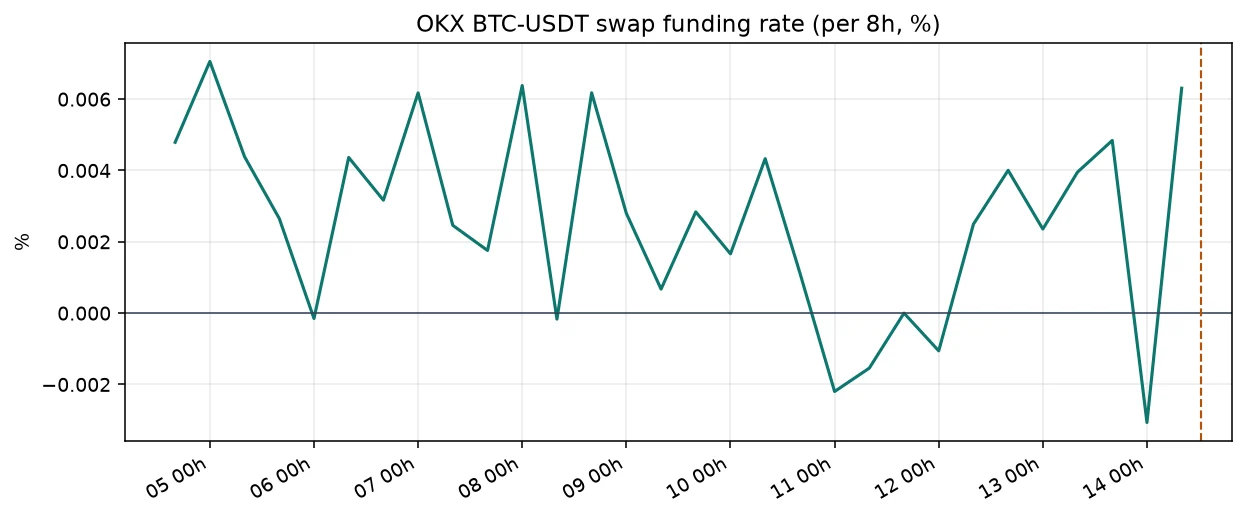
Funding rate is the periodic payment between longs and shorts on a perpetual swap, here shown per eight-hour OKX settlement in percent. Recent settlements clustered near zero to slightly positive; Deribit’s BTC perpetual funding_8h was about 0.0095% at 13:52 UTC, with open interest near $846 million.
Should funding flip negative and stay there while open interest rises, it would show shorts dominating the post-CPI tape. Should funding spike above 0.05% per eight hours with rising open interest, it would show leverage rebuilding into resistance.
Yields Reprice With the Print
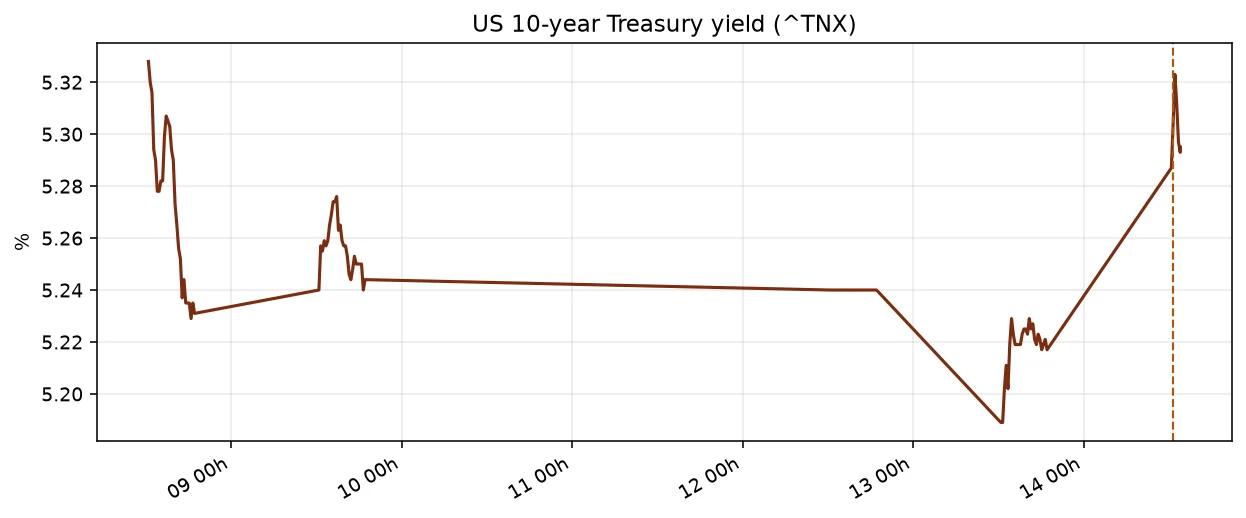
The US 10-year Treasury yield is the market’s benchmark long rate. Yahoo’s ^TNX quote was near 5.30% after the release, up from levels nearer 5.22% in Tuesday’s cash session cited in First Print. A hotter core reading of 2.6% year on year is the bond-market input, not the bitcoin chart alone.
Should the 10-year hold above 5.30% into the next Fed speakers, it would keep financial conditions tight for risk assets. Should it fall back under 5.20% on softer follow-through data, it would ease one of the macro headwinds named in this morning’s note.
Stablecoin Dry Powder Steady
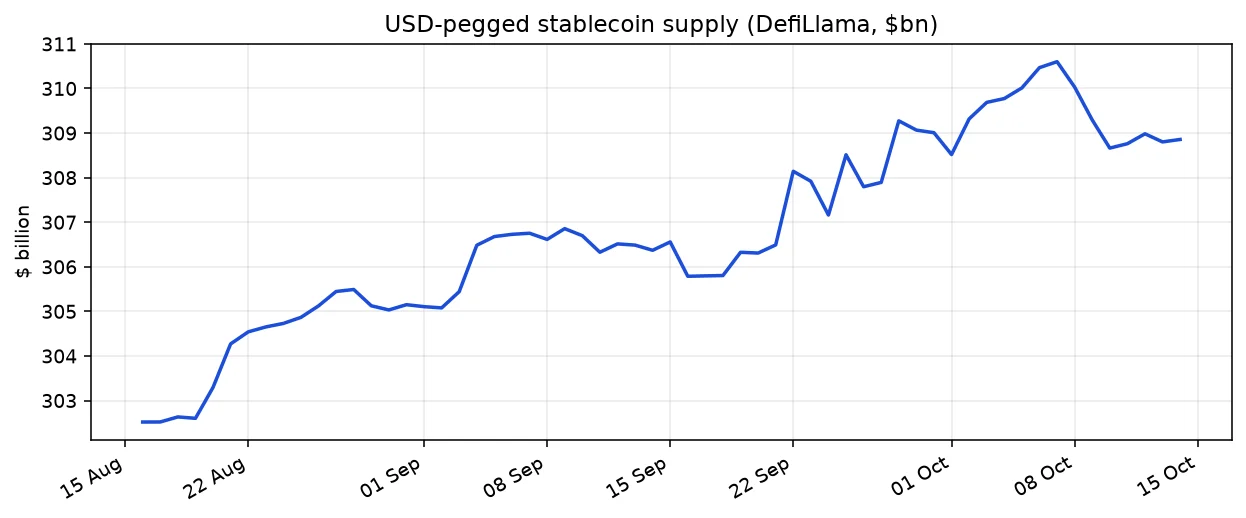
USD-pegged stablecoin supply is the sum of circulating fiat-backed stablecoins tracked by DefiLlama, in dollar terms. The latest chart point was about $309 billion, inside a 60-day range of roughly $302–$311 billion. That stock is potential buying power; it is not a timing signal by itself.
Should supply break above $312 billion while bitcoin reclaims $84,250, it would show fresh dollar stables arriving with upside follow-through. Should supply stall or fall while spot makes new lows under $82,000, it would show dry powder is not being deployed on dips.
Reading the signals
The state is a failed reclaim. Spot repaired Tuesday’s dip, then gave the repair back when CPI printed hot, and Monday’s $84,250 high still defines thin air overhead. The near-term test is whether $82,500–$83,000 holds as a post-print shelf. The bullish trigger is a daily close above $84,250 with another firm ETF session. The bearish trigger is a daily close below $80,951 with funding flipping negative and ETF flows turning red again.
Data as of 13:47–13:52 UTC on 14 Oct 2026 for exchange tickers and Deribit; BLS release 12:30 UTC; Farside 13 Oct row as previously verified by the desk; DefiLlama and Yahoo chart pulls on 14 Oct. Latest points may be revised. Entity labels on any later on-chain overlays are heuristic and may not capture all exchange wallets.
Related: Thursday’s First Print, after the break below Tuesday’s low
This article is for information only and is not investment advice.