
Key findings
- Annualised volatility, the standard deviation of daily returns scaled to a year, is 45.9% for 2026 to 9 Oct, against 82.0% for 2018.
- A “three-sigma day” is a daily move more than three times the standard deviation of the previous 30 days. On that test bitcoin has had 11 such days in 2026, against 8 in all of 2018.
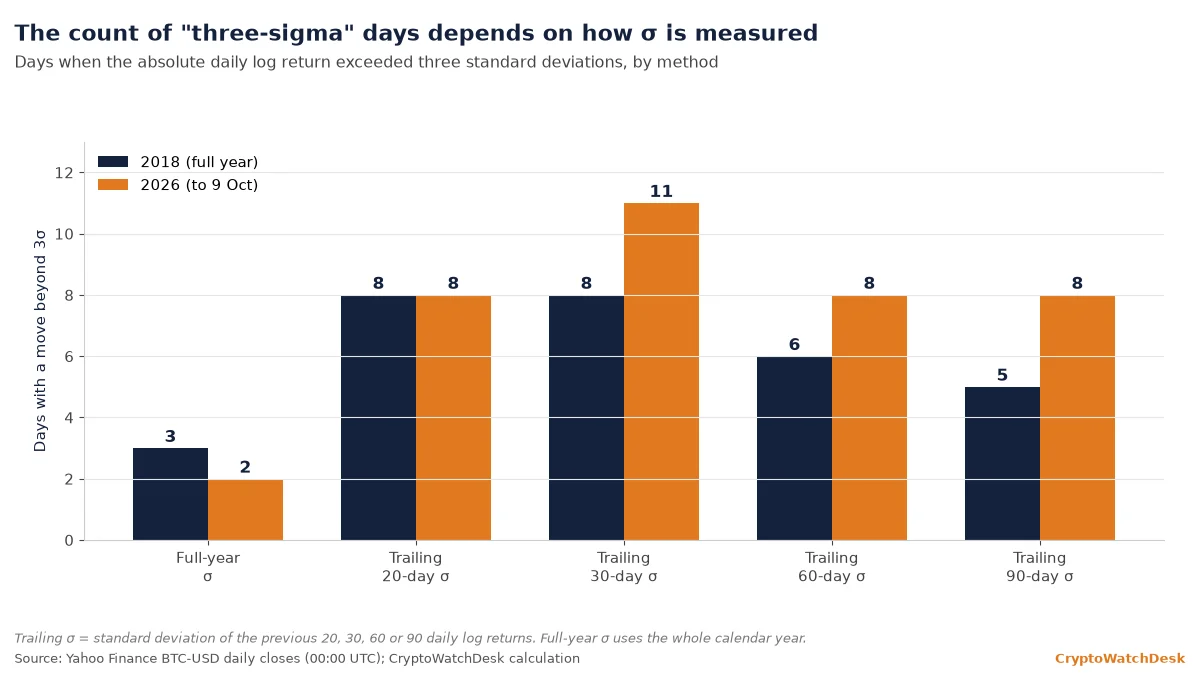
- The ranking is not stable. With 20-day, 60-day and 90-day windows, 2026 has 8 days against 8, 6 and 5 for 2018. Measured against each year’s own standard deviation, 2026 has 2 days against 3.
- Moves of 5% or more between daily closes number 14 in 2026 and 74 in 2018.
- With the trailing 30-day standard deviation at 2.04% a day, a three-sigma day today would need a daily close roughly 6.3% above or 5.9% below the last one.
CoinDesk reported on Friday that bitcoin has had 10 such days in 2026 against eight in 2018, even as volatility fell to about 46% from 84%. It compared each day’s move with the previous 30 days’ realised volatility. This note rebuilds the count from open price data and tests how much the answer depends on that choice.
Volatility is about half of 2018
Annualised volatility here is the standard deviation of daily log returns multiplied by the square root of 365. For 2026 to 9 Oct it is 45.9%. The 2018 figure is 82.0%, and only 2023 and 2025 were calmer than this year among the years shown.
The latest month is calmer still. Realised volatility over the 30 days to 9 Oct is 39.0% annualised. Deribit’s DVOL, a 30-day implied-volatility index built from bitcoin options, read about 36.6 at 09:45 UTC on Saturday. If realised volatility runs above DVOL, options are pricing less movement than the past month delivered. The two are within three points of each other now.
The count depends on the window
A three-sigma day is a day when the absolute log return exceeds three times a standard deviation. The yardstick is the open choice. We tested the standard deviation of the previous 20, 30, 60 and 90 days, and of the whole calendar year.
The 30-day window reproduces CoinDesk’s 2018 count of eight, so it is the default here. It gives 11 days for 2026, one more than CoinDesk’s 10. Two of them, 29 Jan and 20 Aug, clear the threshold by less than a tenth of a sigma, so a small difference in price data can move the total. The most recent is 21 Sep, which matches CoinDesk. The 2026 days average a 7.3% move, against 9.4% for 2018, close to the roughly 7% and 10% CoinDesk reported.
Five of the 2026 days fall in two clusters, 5-6 Feb and 19-21 Aug, so the count reflects a handful of episodes rather than eleven separate shocks. Under the 30-day test the next qualifying close would be a rise of about 6.3% or a fall of about 5.9% from the previous close; the threshold moves each day with the trailing figure.
Reading the signals
The data supports two statements at once. The average bitcoin day is calmer than in every year shown except 2023 and 2025. On the 30-, 60- and 90-day yardsticks, 2026 also has more outsized days than 2018, and the 20-day window leaves them level at 8 each. It does not support a claim that tails are thicker on every measure: against full-year standard deviations, 2026 has fewer.
The test to watch is the next close beyond the threshold. A move past about +6.3% or −5.9% would add a twelfth day to 2026 on the 30-day yardstick. Quiet weekends, such as this morning’s First Print, lower the trailing figure and so make the next jolt easier to flag. Friday’s Market Read covers positioning; what crypto liquidations are explains how forced selling can turn a move into a bigger one.
Data note. Data as of the 9 Oct 2026 daily close (00:00 UTC on 10 Oct); the partial 10 Oct candle is excluded. Source: Yahoo Finance BTC-USD closes; 282 daily returns for 2026. Returns are log returns, standard deviations are sample standard deviations, and trailing windows exclude the day tested. Counts of 5% moves use simple returns. CoinDesk’s figures come from its own data and may differ at the margin. DVOL is Deribit’s hourly index, read at about 09:45 UTC. Not investment advice.
This article is for information only and is not investment advice.