
Scenario analysis, not investment advice. Prices as of 11:00 UTC.
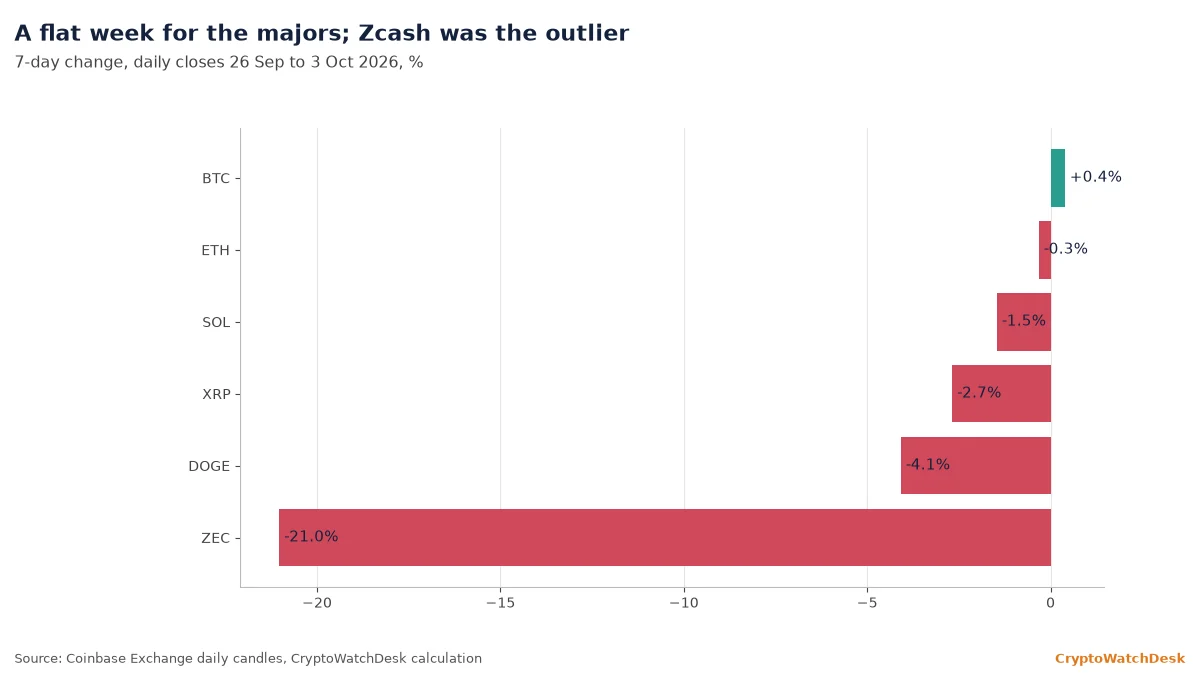
The Zcash price has fallen 21% in a week. ZEC closed on Saturday, 3 Oct, at $1,304.95 on Coinbase, down from $1,652.43 on 26 Sep, when it set an intraday high of $1,693.20. Over the same seven days bitcoin was up 0.4%, so this has been a coin-specific move rather than a market-wide one.
Related: Joaquín’s read on Friday’s bitcoin reversal
The flow side has turned. Grayscale’s Zcash ETF, ZCSH, recorded net outflows on four straight trading days from 28 Sep to 2 Oct: $8.12 million, $30.25 million, $28.26 million and $26.93 million, according to SoSoValue data compiled by the ZecZcash tracker. The $93.56 million total is the fund’s first weekly outflow since it began trading on 25 Aug. Cumulative net inflows fell to $212.56 million and net assets to $751.03 million.
Related: ETF Desk for 2 Oct
US funds do not trade at weekends, so the next flow figure will cover Monday, 5 Oct, and settle on Tuesday. Until then, ZEC trades without that input, and weekend liquidity is usually thinner, which can exaggerate moves in either direction. For context, bitcoin traded near $85,260 on Coinbase at 11:00 UTC, in the middle of its recent range.
The indicators below use Coinbase daily closes through 3 Oct. The 20-day exponential moving average (EMA) gives more weight to recent prices; the 50-day simple moving average (SMA) is a plain average of the last 50 closes; the relative strength index (RSI) is a 0-100 momentum gauge.
Related: What a moving average is
Zcash price analysis
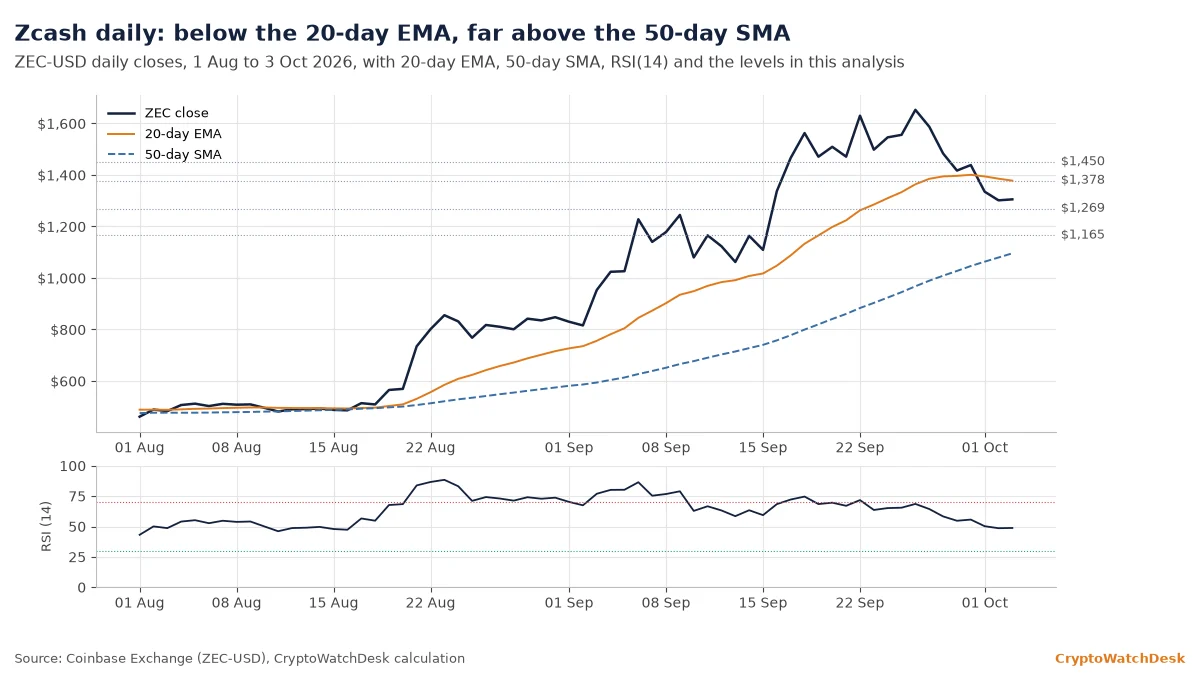
ZEC traded at $1,332 as of 11:00 UTC on Sunday, inside a $1,302 to $1,345 range for the day so far. That is below the 20-day EMA at $1,377.5 and well above the 50-day SMA at $1,095.4. The RSI reads 48.8, which means the momentum built during September has gone, but sellers are not in control either.
If buyers push and hold above the 20-day EMA near $1,378 on a daily close, the price could climb toward $1,450, the 1 Oct high. Above that, $1,495, the 30 Sep high, is the level that capped the first rebound attempt.
A daily close below $1,269, Friday’s low, would open the way to $1,165, the middle of the band where ZEC consolidated in mid-September. Below that band, the next reference is the 50-day SMA near $1,095, about 18% under the current price.
The recovery reading is invalidated on a daily close below $1,269. The bearish reading is invalidated on a daily close above $1,450, which would put ZEC back above every daily close since 30 Sep.
Zcash price levels to watch
| Level | Price (Coinbase) | Why it matters |
|---|---|---|
| Resistance 2 | $1,495 | 30 Sep high; capped the first rebound |
| Resistance 1 | $1,450 | 1 Oct high; bearish reading invalidated above it |
| Pivot | $1,378 | 20-day EMA as of 3 Oct close |
| Support 1 | $1,283 to $1,300 | 3 Oct low and round number; held on Saturday |
| Support 2 | $1,269 | 2 Oct low; recovery reading invalidated below it |
| Support 3 | $1,165 | Middle of the 6-15 Sep consolidation (closes $1,062 to $1,244) |
| Support 4 | $1,095 | 50-day SMA as of 3 Oct close |
The two conditions are not equally likely to be tested soon. The 20-day EMA is about 3% above the current price, while $1,269 is about 5% below. Both are within one ordinary day’s range for ZEC in the past fortnight: the 2 Oct candle alone spanned $1,269 to $1,412, and the 28 Sep candle ran from $1,600 down to $1,442.
The weekly picture explains why the 50-day SMA sits so far below. ZEC closed at $461.24 on 1 Aug and at $1,652.43 on 26 Sep, a gain of about 258% in eight weeks, according to Coinbase data. It first closed above $1,300 only on 16 Sep. The 50-day average still contains many of those lower August closes, so it lags the price by a wide margin.
That matters for how the current drop is read. A 21% pullback after a 258% advance is, on its own, within the range of normal retracements. A pullback that stops above the mid-September band would leave the medium-term uptrend intact. A move through the 50-day SMA would not.
Two things would change this map before Monday. The first is a decisive break of either the $1,378 or the $1,269 level on a daily close. The second is the next ZCSH flow print: a return to inflows would weaken the case that the fund is a steady seller, while a fifth straight outflow day would strengthen it.
Yesterday’s levels: how they held: The $1,283 to $1,300 area held on a closing basis on 3 Oct; ZEC dipped to $1,283.23 and closed at $1,304.95, above Friday’s $1,269 low.
Technical levels are probabilistic and are often wrong. Do your own research; never trade with money you can’t afford to lose.
Data: Coinbase Exchange (prices, indicators), SoSoValue via ZecZcash (ETF flows). Prices as of 4 Oct 2026, 11:00 UTC.
This article is for information only and is not investment advice.