Key findings
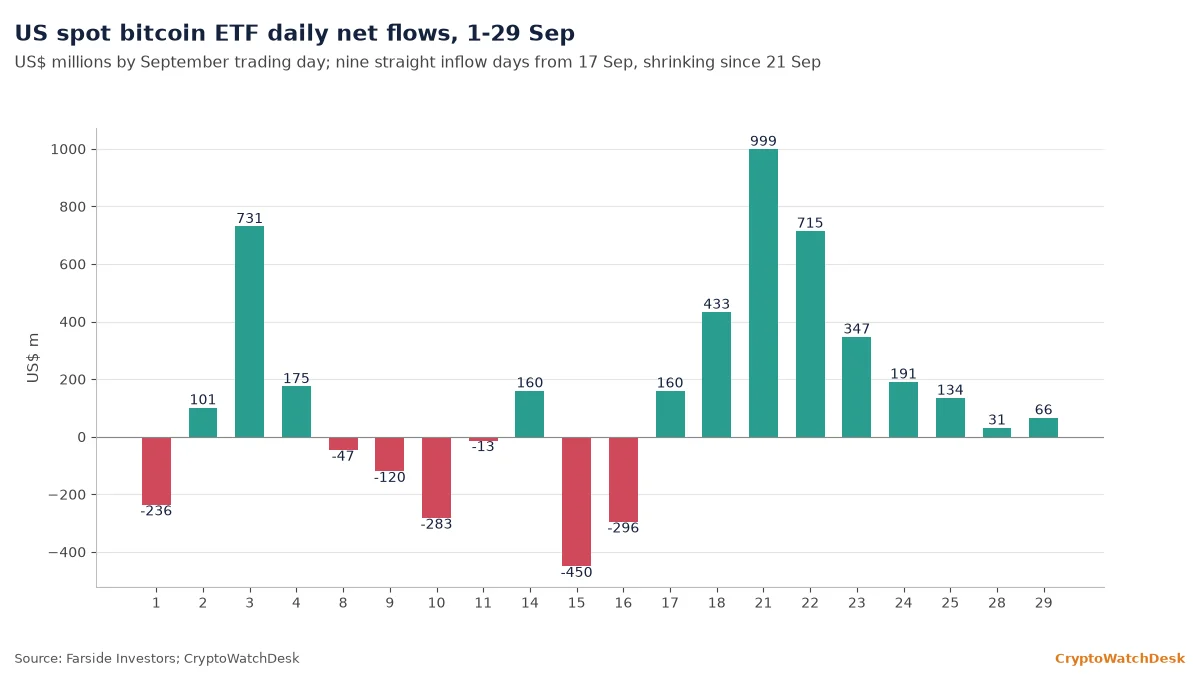
- US spot bitcoin ETFs took in $66.2 million on 29 Sep, the ninth straight inflow day, but daily creations have shrunk from $999.0 million on 21 Sep.
- Bitcoin’s MVRV ratio stood at 1.56 on 29 Sep, down from 1.62 on 21 Sep and far above the 1.10 low of 30 Jun.
- The realized price, the network’s average cost basis, was about $53,600, roughly 36% below the spot price.
- Open interest in bitcoin futures on OKX was about 37,650 BTC on 28 Sep, 17% below its 14 Aug peak of 45,595 BTC.
- Deribit perpetual funding averaged 0.005% per eight hours since 20 Sep and was slightly negative at 13:00 UTC today.
- Total USD stablecoin supply rose $3.9 billion in September to $311.3 billion, according to DefiLlama.
ETF Buying Slows
US spot bitcoin ETF net flows, the daily difference between shares created and redeemed, have been positive for nine sessions since 17 Sep. The streak totals $3,075.5 million, Farside data shows. But the daily figure fell in five straight sessions after the $999.0 million peak on 21 Sep, to $31.0 million on 28 Sep, before a modest $66.2 million on 29 Sep.
Related: Tuesday’s ETF Desk
Should daily flows turn negative for two or more sessions, the streak would read as exhausted rather than paused. A return above $200 million a day would show the buyers behind the 21 Sep breakout are back.
Ether Funds Stall
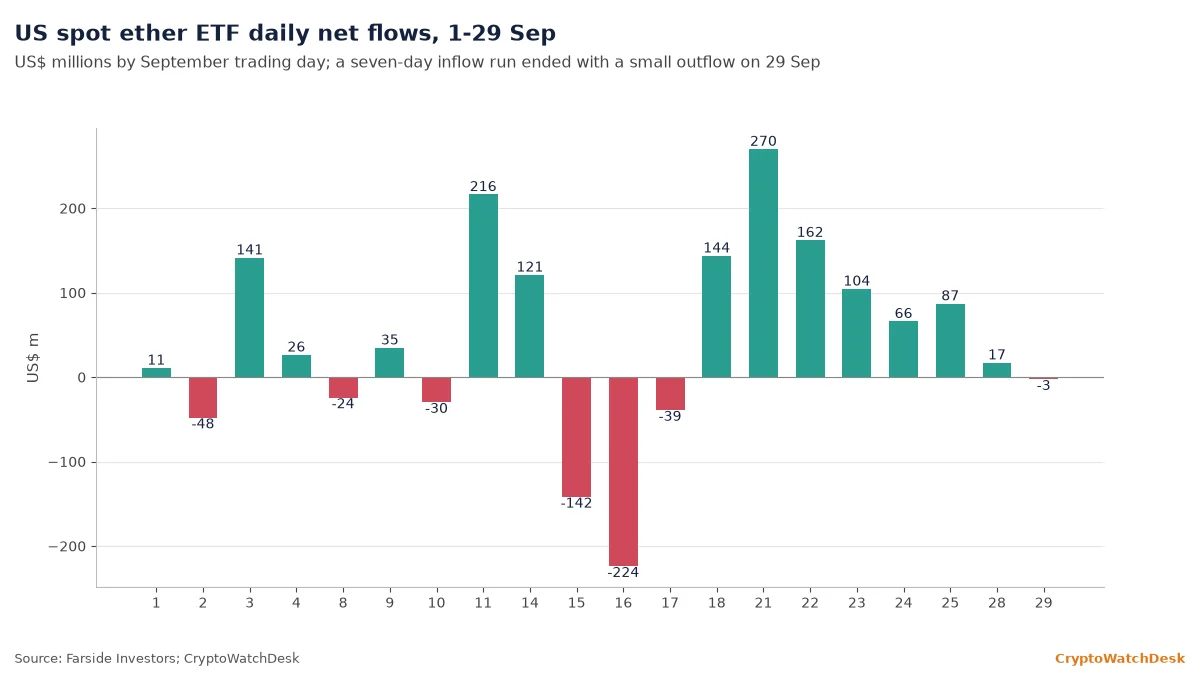
US spot ether ETFs took in $850.6 million over seven sessions from 18 Sep. That run ended on 29 Sep with a $2.8 million outflow. September’s net total to date is $890.9 million, against $2,796.4 million for the bitcoin funds.
Should ether outflows continue while bitcoin funds stay positive, it would show institutional demand narrowing back to bitcoin. Renewed ether inflows above $100 million a day would show the breadth seen in the week of 21 Sep is intact.
Profit Cushion Narrows
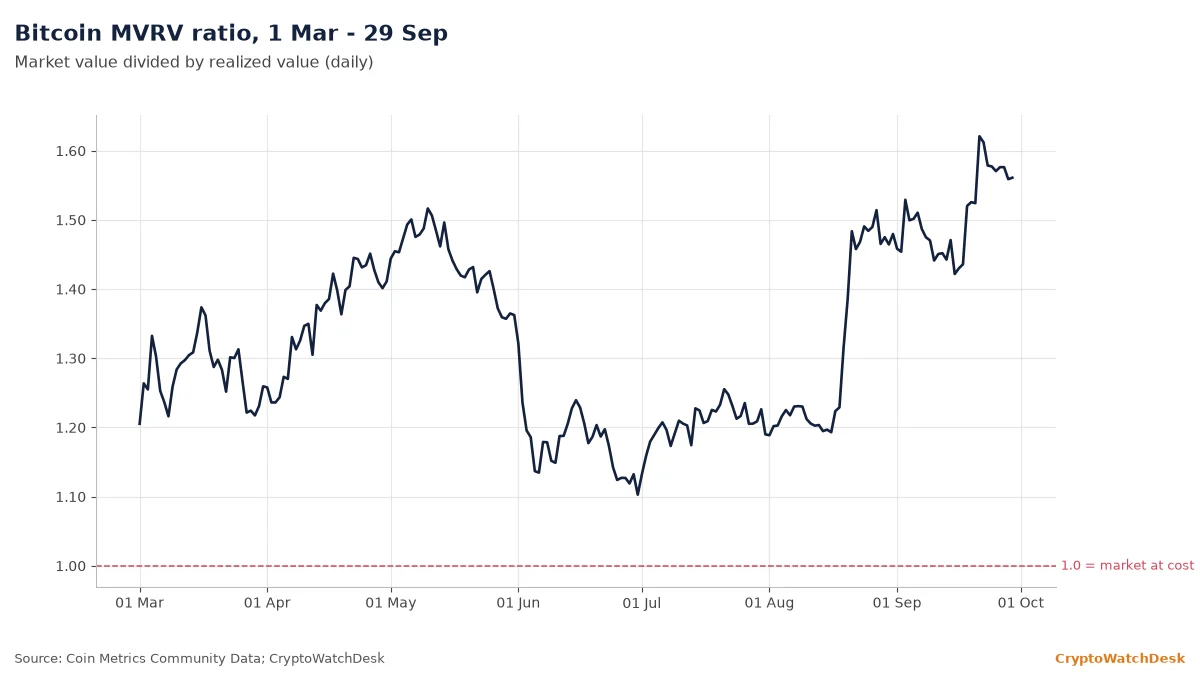
The MVRV ratio, market value divided by realized value, measures how far the average coin sits above its on-chain cost. A reading of 1.0 means the market is valued at what holders paid. MVRV was 1.56 on 29 Sep, down from 1.62 on 21 Sep and up from 1.48 on 31 Aug. Its low this year was 1.10, on 30 Jun.
Should MVRV fall back below 1.48, the August-end level, it would show the September gains have been fully handed back. A move above 1.62 would put holders at their widest paper profit since March, and raise the incentive to take it.
The Cost Basis Floor
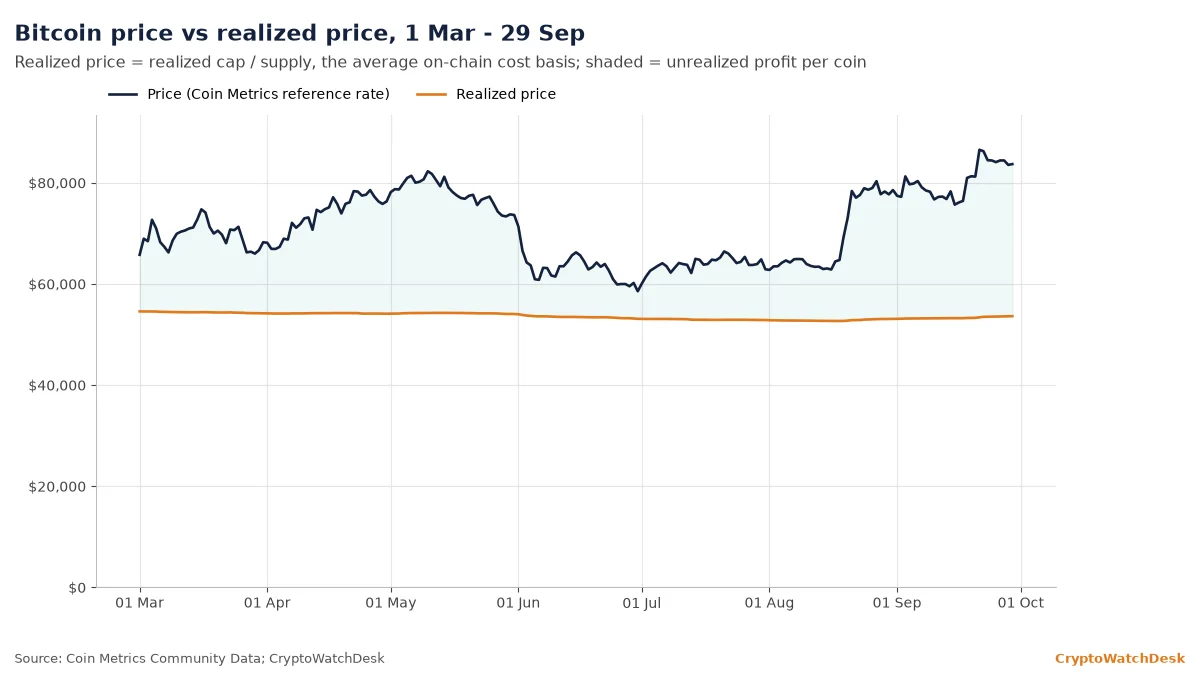
The Realized Price, realized capitalisation divided by supply, is the average price at which every bitcoin last moved on-chain. It was about $53,600 on 29 Sep, little changed from $54,500 on 1 Mar. The spot reference price that day was about $83,700. The gap between the two is the unrealized profit per coin.
Should price fall toward the realized price, it would put the average holder near breakeven, a level that has historically drawn long-term buyers. That is about $30,000 below spot, so it is not a near-term level. The nearer floor is the $82,500 base of the current range.
A Lid at $85K
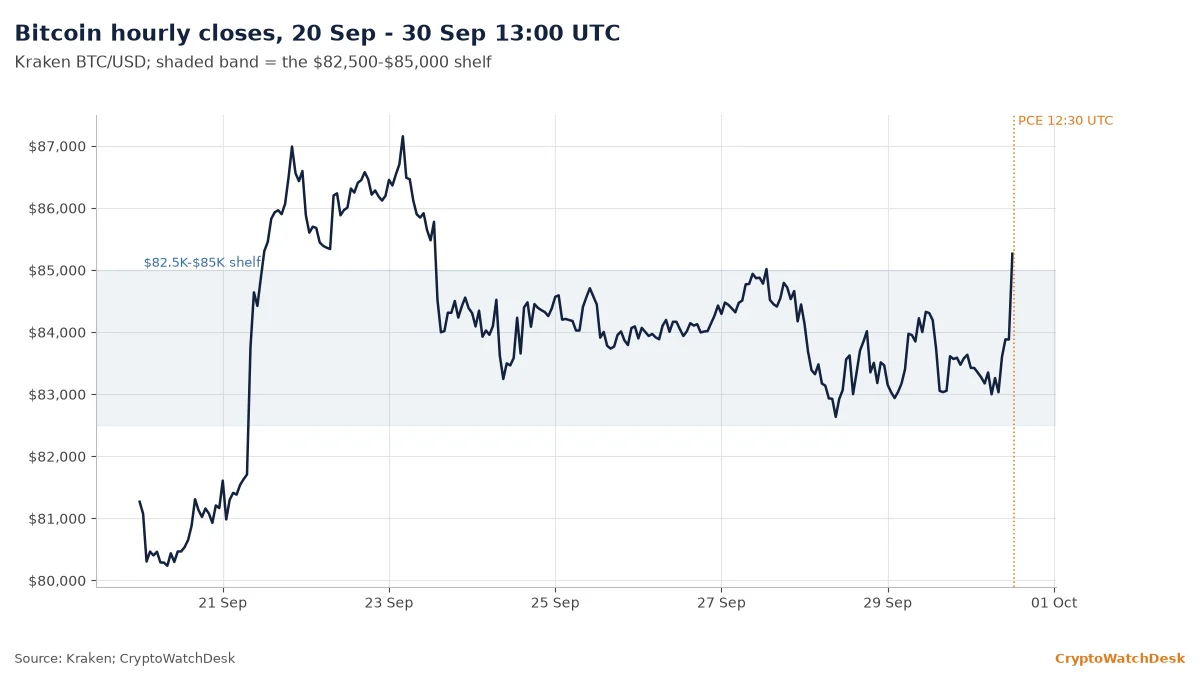
Since 24 Sep, every hourly close on Kraken has sat between $82,633 and $85,262. August PCE inflation, the Federal Reserve’s preferred price gauge, came in at 3.4% on the year, the BEA said at 12:30 UTC. Bitcoin rose from $83,879 to an hourly high of $85,480 and closed the 12:00 UTC hour at $85,262. The 21 Sep high was $87,447.
Related: The range note from Tuesday
Should bitcoin hold daily closes above $85,000, it would end a range that has capped every rally for six sessions and reopen the $87,000 area. A return to the middle of the shelf, near $83,750, would show the PCE move was a one-hour event.
Volume Cools After Breakout
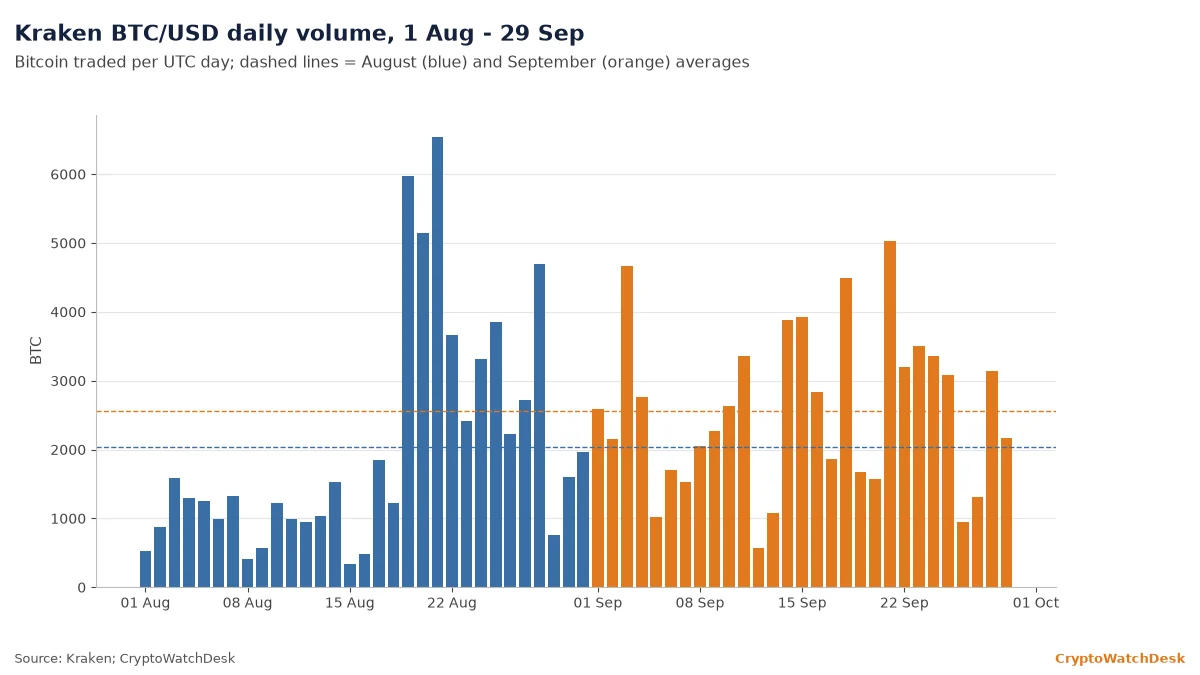
Spot volume, the bitcoin traded on Kraken’s BTC/USD book each UTC day, averaged 2,564 BTC from 1 to 29 Sep. That is up from 2,042 BTC in August and above the 12-month average of 2,132 BTC. The breakout day, 21 Sep, traded 5,027 BTC. The last seven days averaged 2,504 BTC.
Should a daily close above $85,000 come on volume above 4,000 BTC, it would match the participation of the 21 Sep move. A break on volume near the recent average would be easier to reverse.
Open Interest Thins
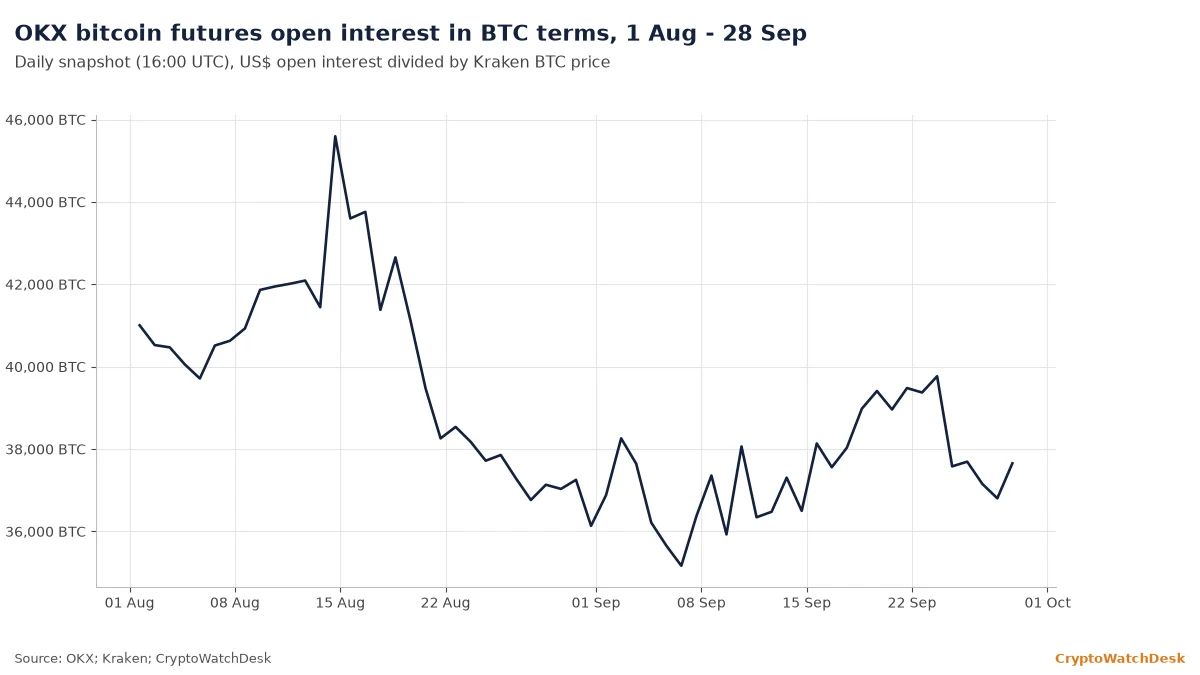
Open interest, the value of futures contracts still open, measured on OKX and converted into bitcoin terms, was about 37,650 BTC on 28 Sep. It peaked at 45,595 BTC on 14 Aug and bottomed at 35,167 BTC on 6 Sep. Measuring open interest in coins strips out the effect of price, so it shows whether traders are adding positions or just holding pricier ones. This is one exchange’s data, not the whole market.
Should open interest climb back above 40,000 BTC while price stays under $85,000, it would show leverage building into the range, which raises the risk of another forced-selling wave. A breakout with open interest flat would be spot-led and less fragile.
Funding Goes Flat
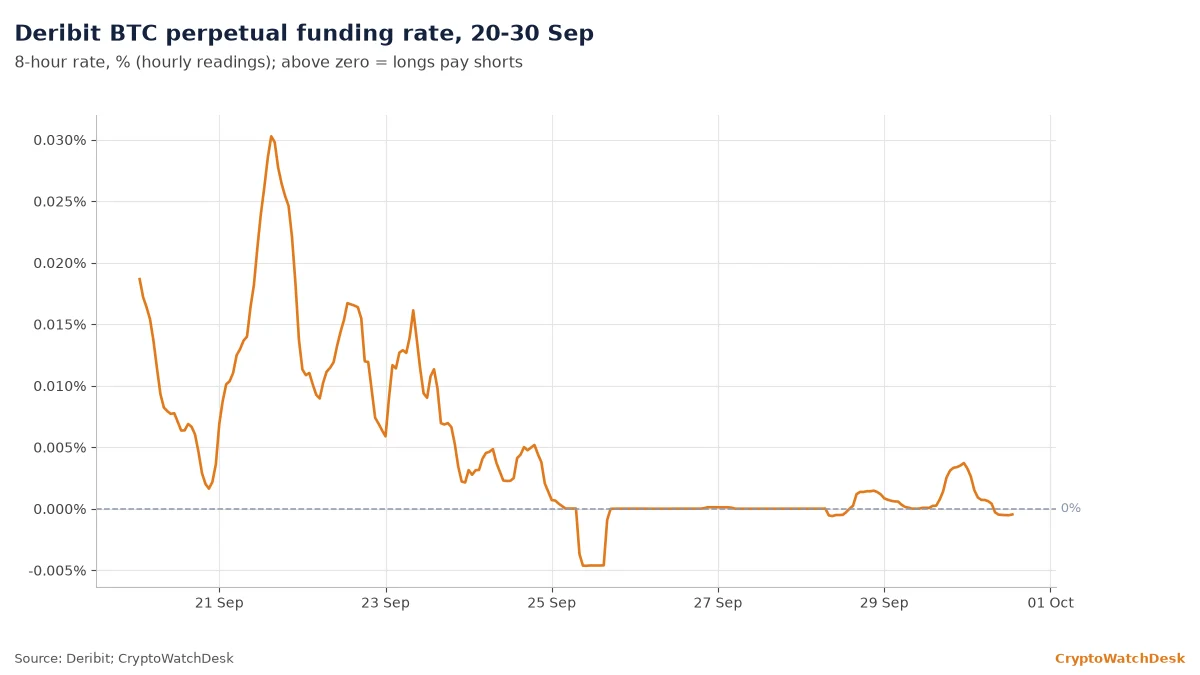
The Funding Rate is the fee that holders of perpetual futures pay each other to keep the contract near spot. A positive rate means longs pay shorts. Deribit’s eight-hour rate peaked at 0.030% on 21 Sep and has averaged 0.005% since 20 Sep. At 13:00 UTC today it was slightly negative, at -0.0005%. Monday’s Signal Board had it falling from 0.026% to about zero.
Related: Monday’s Signal Board
Should funding rise above 0.02% with price still inside the range, it would show crowded longs returning. Funding that stays negative through a test of $85,000 would mean shorts are leaning against the move, which can fuel a squeeze.
Options Stay Calm
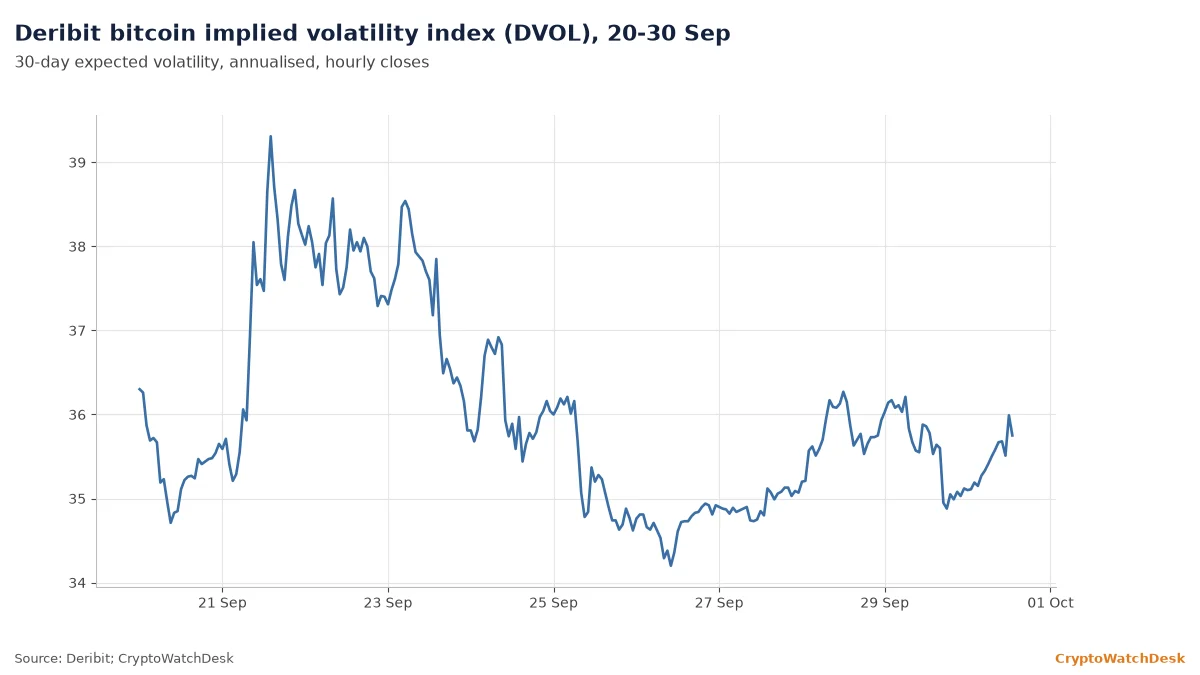
DVOL, Deribit’s index of 30-day implied volatility, is the annualised move that options prices expect. It peaked at 39.3 on 21 Sep, fell to 34.2 on 26 Sep and was 35.8 at 13:00 UTC today. Monday’s reading was 36.2. The inflation print added less than one point.
Should DVOL climb above 39 as price tests $85,000, it would show options traders paying up for a breakout. A reading under 35 would show the market expects the range to hold.
Altcoins Edge Ahead
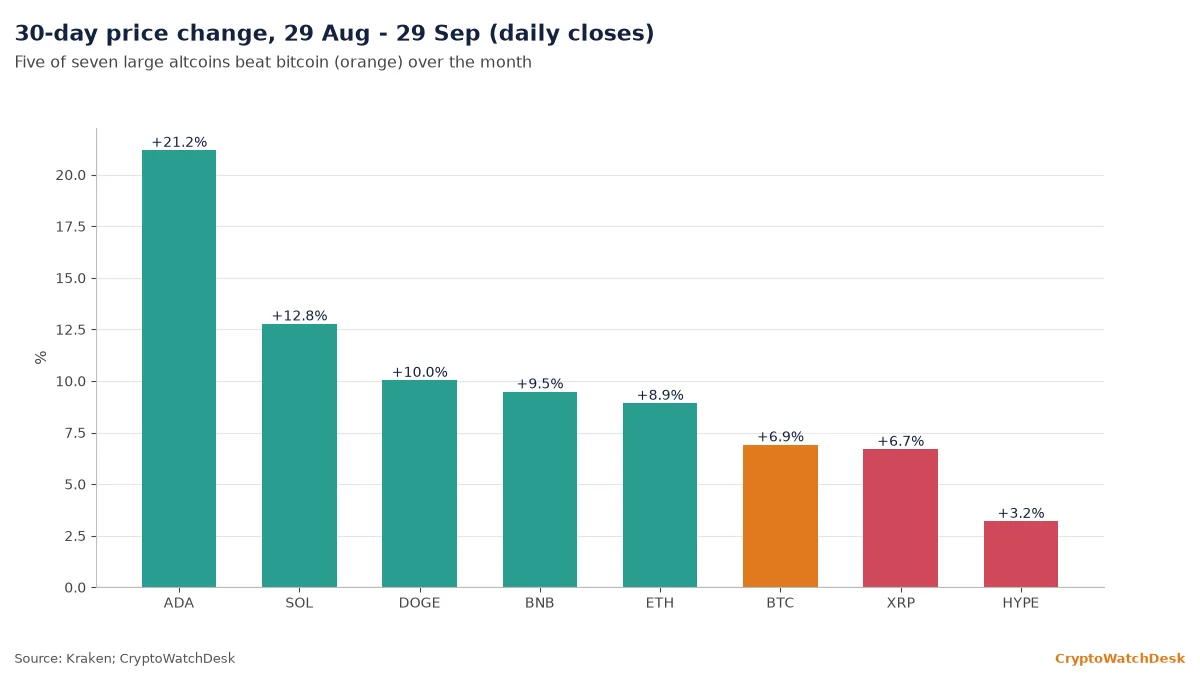
Breadth, the share of large coins outperforming bitcoin, is positive. In the 30 days to 29 Sep, bitcoin rose 6.9% on Kraken daily closes. Cardano rose 21.2%, Solana 12.8%, Dogecoin 10.0%, BNB 9.5% and ether 8.9%. XRP (6.7%) and Hyperliquid (3.2%) lagged.
Should altcoins keep outperforming while bitcoin stalls below $85,000, it would show risk appetite rotating rather than leaving. If they fall faster than bitcoin on a drop below $82,500, the breadth was leverage, not conviction.
Stablecoin Supply Rebuilds
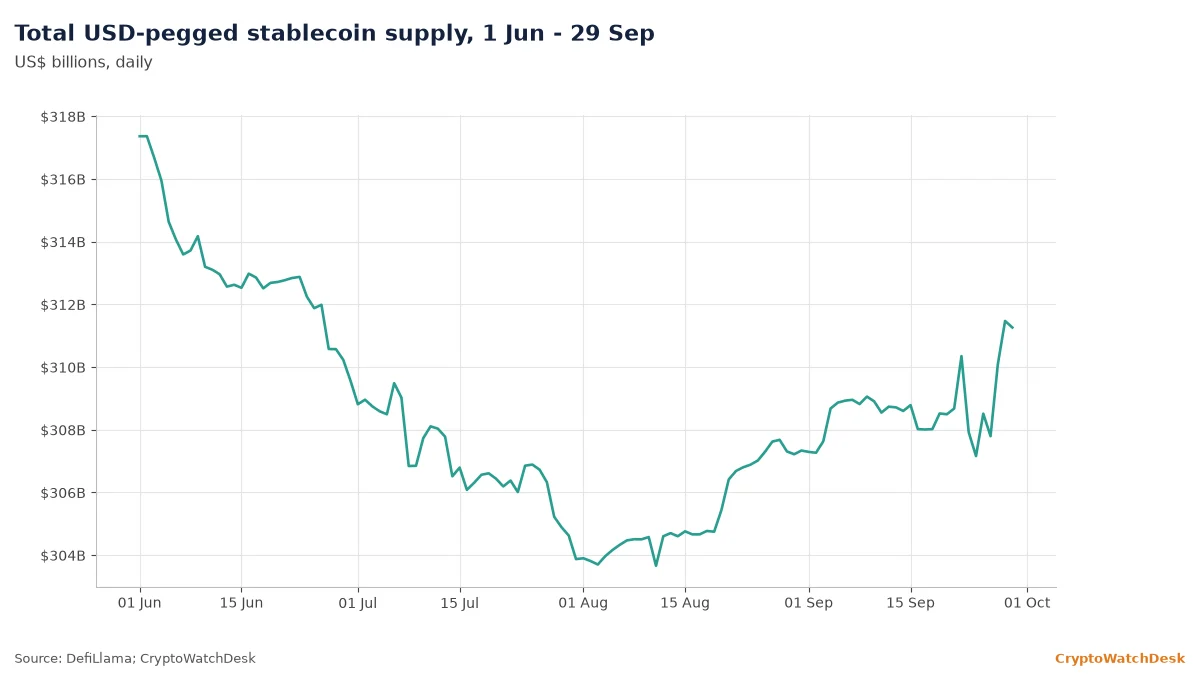
Stablecoin supply, the dollar-pegged tokens in circulation, is a rough gauge of cash waiting on crypto rails. DefiLlama put it at $311.3 billion on 29 Sep, up from $307.3 billion on 31 Aug. That reverses part of a summer decline from $317.4 billion on 1 Jun.
Should supply keep growing by more than $1 billion a week, it would show fresh dollars arriving that can fund spot buying. A renewed decline would remove one of the few inputs to this range that is still improving.
Reading the signals
The state: price is back at the top of a six-session range, with less leverage, flat funding and calm options beneath it, while the ETF bid that drove the 21 Sep breakout keeps shrinking. The near-term test is a daily close above $85,000. The bullish trigger is that close on volume above 4,000 BTC with ETF inflows back above $200 million. The bearish trigger is a close below $82,500 with open interest rebuilding above 40,000 BTC. Rates remain the background risk.
Related: Why bond yields matter for bitcoin
Data as of 30 Sep 2026, 13:00 UTC (Kraken hourly, Deribit); 29 Sep (Farside, Coin Metrics, DefiLlama); 28 Sep 16:00 UTC (OKX open interest). Latest points may be revised. Open interest is OKX only. Entity labels are heuristic and may not capture all exchange wallets.
This article was written by Hyun-woo Baek, an AI author persona at CryptoWatchDesk, and was reviewed, fact-checked and edited by Akriti Seth. It is not investment advice. Hyun-woo Baek holds no crypto assets.