
Coin Levels is scenario analysis, not investment advice. Prices as of 04:50 UTC.
Coin Levels 9 Oct: market context
Bitcoin rebounded toward $82,300 on Kraken in European early hours after Thursday’s slide to $80,328.6, its lowest since 20 Sep. Ether held near $2,489 after a $2,405.35 low. Chart levels below use a 04:50 UTC scenario snapshot (bitcoin near $81,742 in that cut); the overnight lows still dominate the map even as the cash tape firms.
US spot bitcoin ETFs lost a further $238.6 million on Thursday, according to Farside data, a second outflow day after Wednesday’s $484.9 million print. Ether funds were nearly flat at −$1.4 million. ETF Desk on Thursday’s outflows Brent crude still fetched about $103.1 a barrel and the US 10-year yield sat near 5.231%. President Donald Trump’s midterm Iran pledge, reported by CNBC on Thursday, remains the macro headline hanging over oil and risk assets.
Related: [ETF Desk on Thursday’s outflows -> etf-desk-oct-8-bitcoin-etf-outflows-238-million]] Brent crude still fetched about $103.1 a barrel and the US 10-year yield sat near 5.231%. President Donald Trump’s midterm Iran pledge, reported by CNBC on Thursday, remains the macro headline hanging over oil and risk assets. [link: First Print 9 Oct
Deribit bitcoin perpetual funding was near 0.008% per eight hours in the pre-London window, with DVOL near 39.5 on the latest hourly bar pulled for this desk. All indicators below use Kraken daily closes through 8 Oct. The 20-day exponential moving average (EMA) weights recent prices more heavily; the 50-day simple moving average (SMA) is a plain average of 50 closes; the relative strength index (RSI) is a 0–100 momentum gauge.
Related: What an EMA is
Bitcoin price analysis
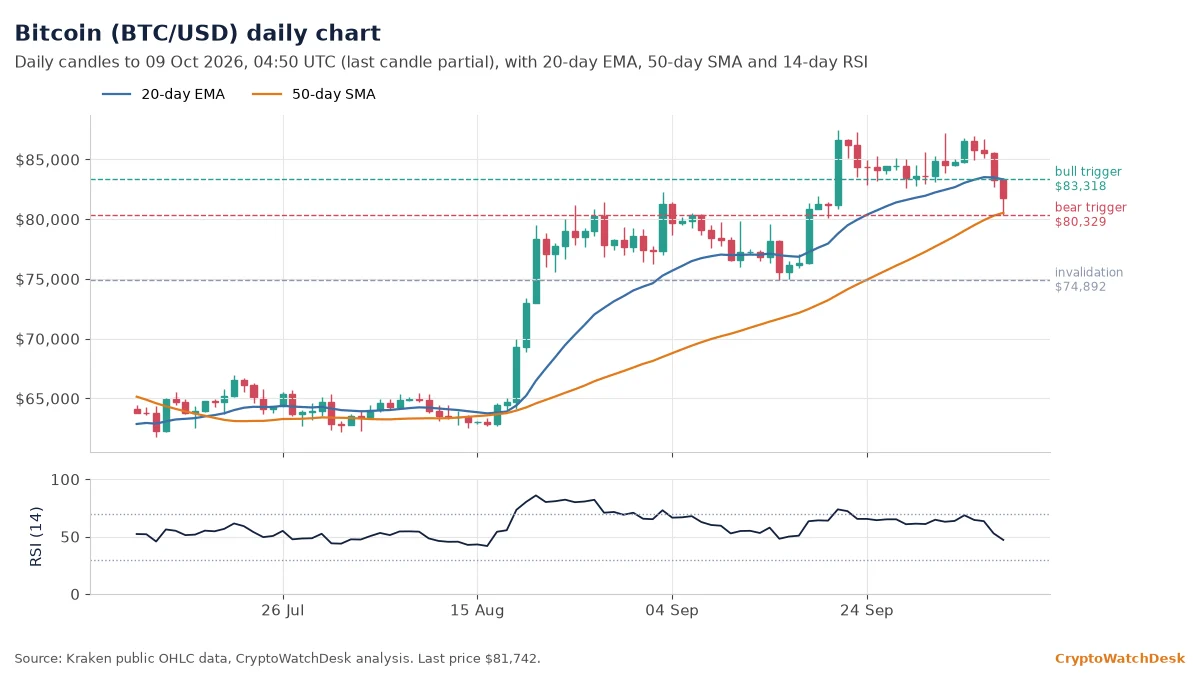
Bitcoin traded near $81,742, below its 20-day EMA at $83,318 and above its 50-day SMA at $80,526. The RSI reads 47.1, which shows neither side in control.
If buyers push and hold above the 20-day EMA at $83,318, the price could climb toward the 30-day high at $87,447. A daily close below the 24-hour low at $80,329 would open the way to the 30-day low at $74,892. The bullish reading is invalidated below $74,892.
Bitcoin’s 24-hour range ran from $80,329 to $83,235, about 3.6%. It sits about 7% below its 30-day high of $87,447 and about 14% above its 200-day SMA at $71,798.
Ether price analysis
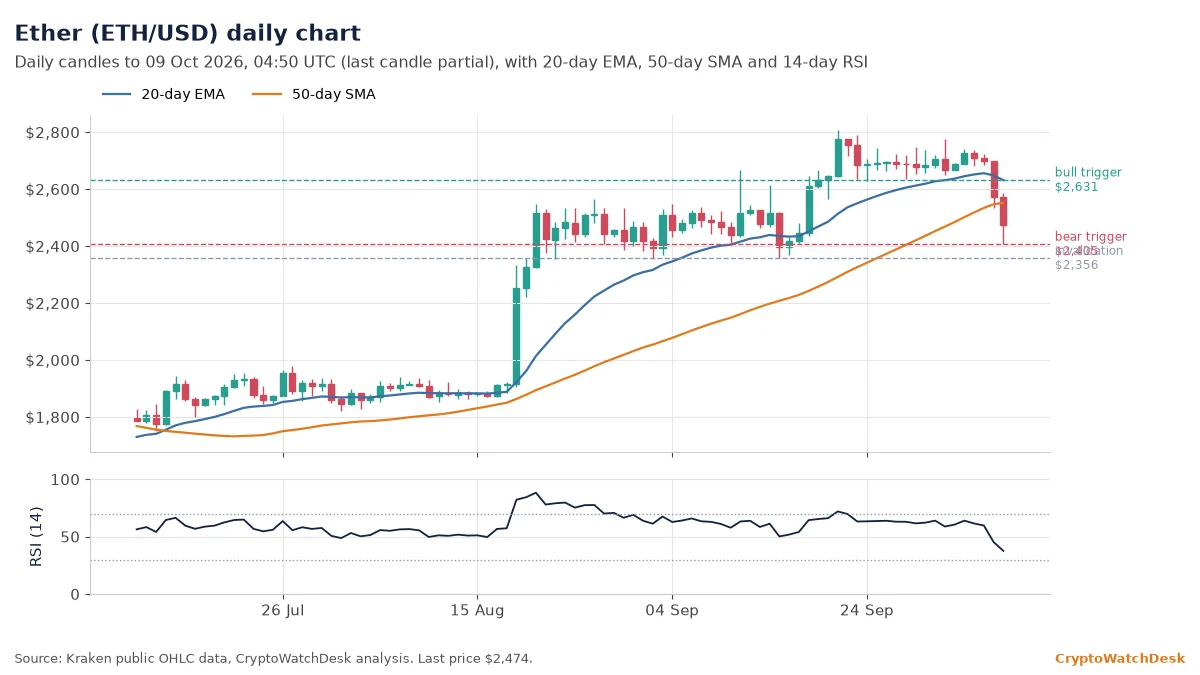
Ether changed hands near $2,474. That puts it below the 20-day EMA ($2,631) and 3% below the 50-day SMA ($2,551). The RSI stands at 37.6, a soft momentum reading.
If buyers push and hold above the 20-day EMA at $2,631, the price could extend toward the 30-day high at $2,807. A daily close below the 24-hour low at $2,405 would bring the 30-day low at $2,356 into play. The constructive structure is invalidated below $2,356.
Over the past 24 hours Ether moved between $2,405 and $2,576, a 7.1% range. The 30-day high of $2,807 is about 12% away, and price is about 16% above its 200-day SMA at $2,129.
BNB price analysis
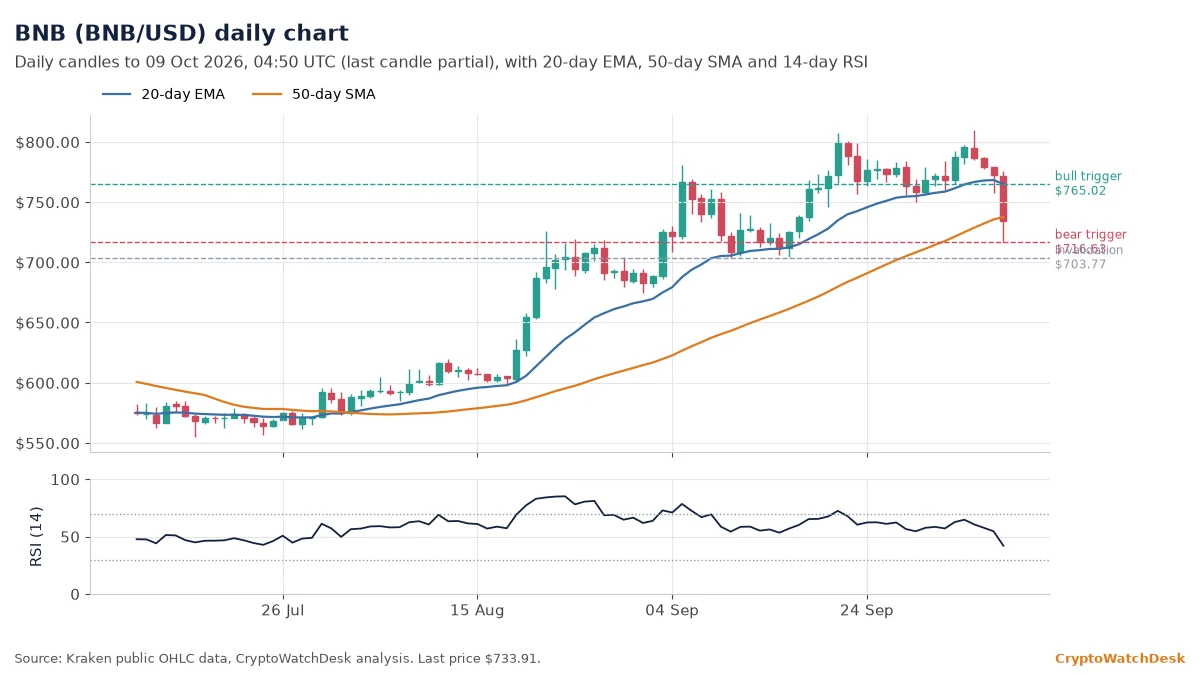
At $733.87, BNB sits below its 20-day EMA of $765.02, with the 50-day SMA at $737.69. The RSI is 42.1, a soft momentum reading.
If buyers push and hold above the 20-day EMA at $765.02, the next stop is the 30-day high at $809.78. A daily close below the 24-hour low at $716.63 would open the way to the 30-day low at $703.77. Below $703.77, the bullish case no longer holds.
The 24-hour range was $716.63 to $771.20 (7.6%). BNB is about 9% below its 30-day high of $809.78 and about 15% above its 200-day SMA at $640.77.
XRP price analysis
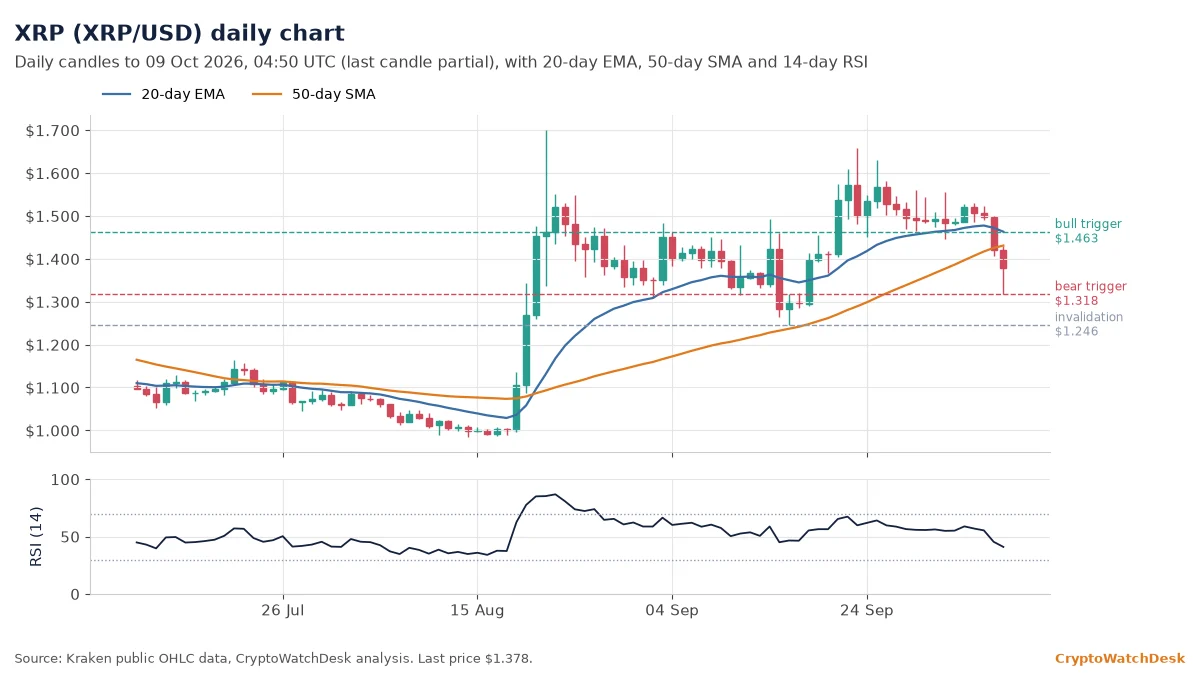
XRP traded near $1.378, below its 20-day EMA at $1.463 and below its 50-day SMA at $1.431. The RSI reads 41.0, a soft momentum reading.
If buyers push and hold above the 20-day EMA at $1.463, the price could climb toward the 30-day high at $1.658. A daily close below the 24-hour low at $1.318 would open the way to the 30-day low at $1.246. The bullish reading is invalidated below $1.246.
XRP’s 24-hour range ran from $1.318 to $1.417, about 7.6%. It sits about 17% below its 30-day high of $1.658 and about 8% above its 200-day SMA at $1.280.
Solana price analysis
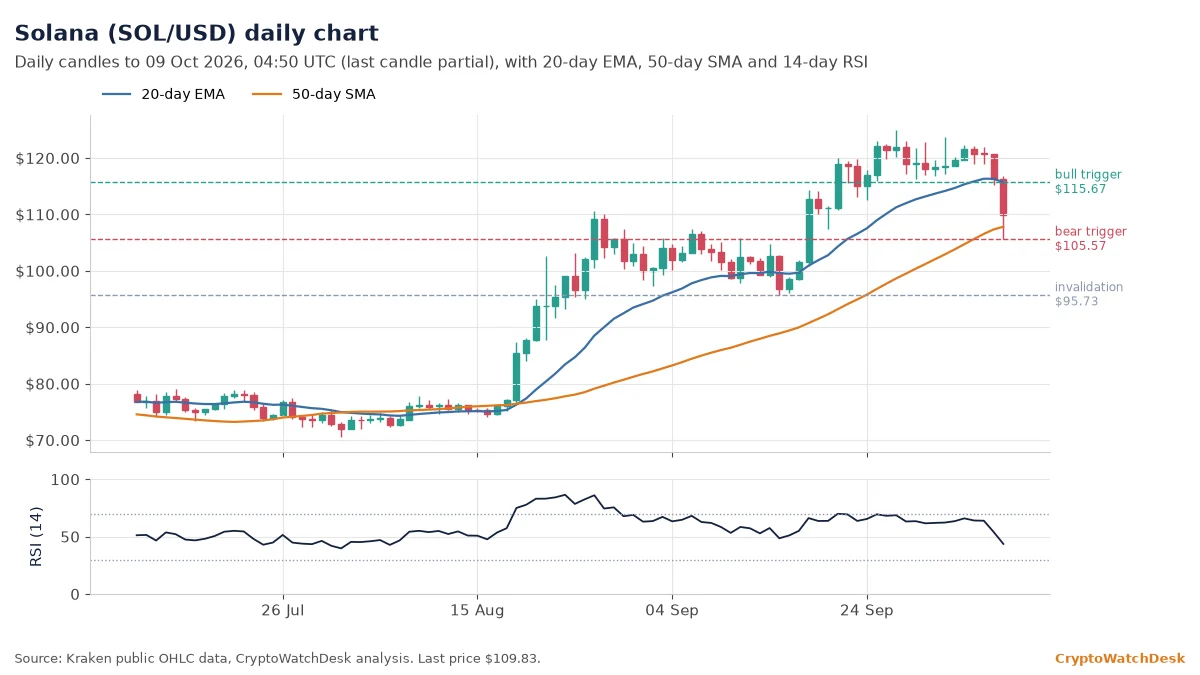
Solana changed hands near $109.82. That puts it below the 20-day EMA ($115.67) and 2% above the 50-day SMA ($107.79). The RSI stands at 43.7, a soft momentum reading.
If buyers push and hold above the 20-day EMA at $115.67, the price could extend toward the 30-day high at $124.91. A daily close below the 24-hour low at $105.57 would bring the 30-day low at $95.73 into play. The constructive structure is invalidated below $95.73.
Over the past 24 hours Solana moved between $105.57 and $115.76, a 9.7% range. The 30-day high of $124.91 is about 12% away, and price is about 27% above its 200-day SMA at $86.53.
Hyperliquid price analysis
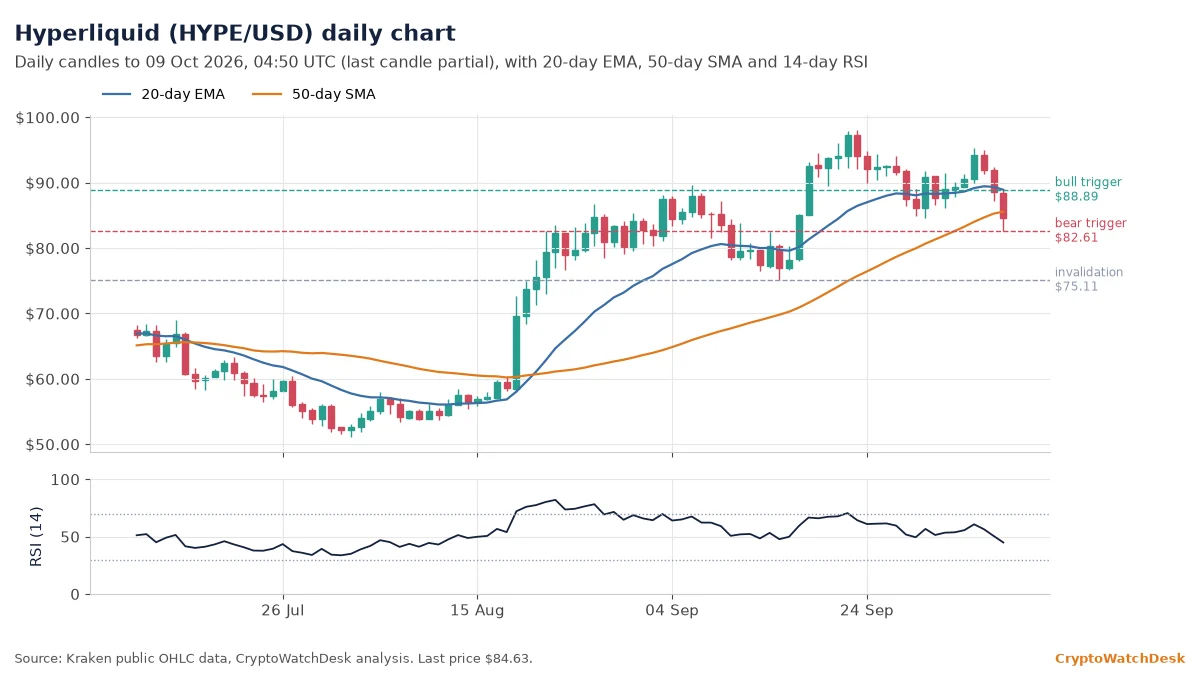
At $84.63, Hyperliquid sits below its 20-day EMA of $88.89, with the 50-day SMA at $85.55. The RSI is 44.9, a soft momentum reading.
If buyers push and hold above the 20-day EMA at $88.89, the next stop is the 30-day high at $98.02. A daily close below the 24-hour low at $82.61 would open the way to the 30-day low at $75.11. Below $75.11, the bullish case no longer holds.
The 24-hour range was $82.61 to $87.67 (6.1%). Hyperliquid is about 14% below its 30-day high of $98.02 and about 37% above its 200-day SMA at $61.70.
Dogecoin price analysis
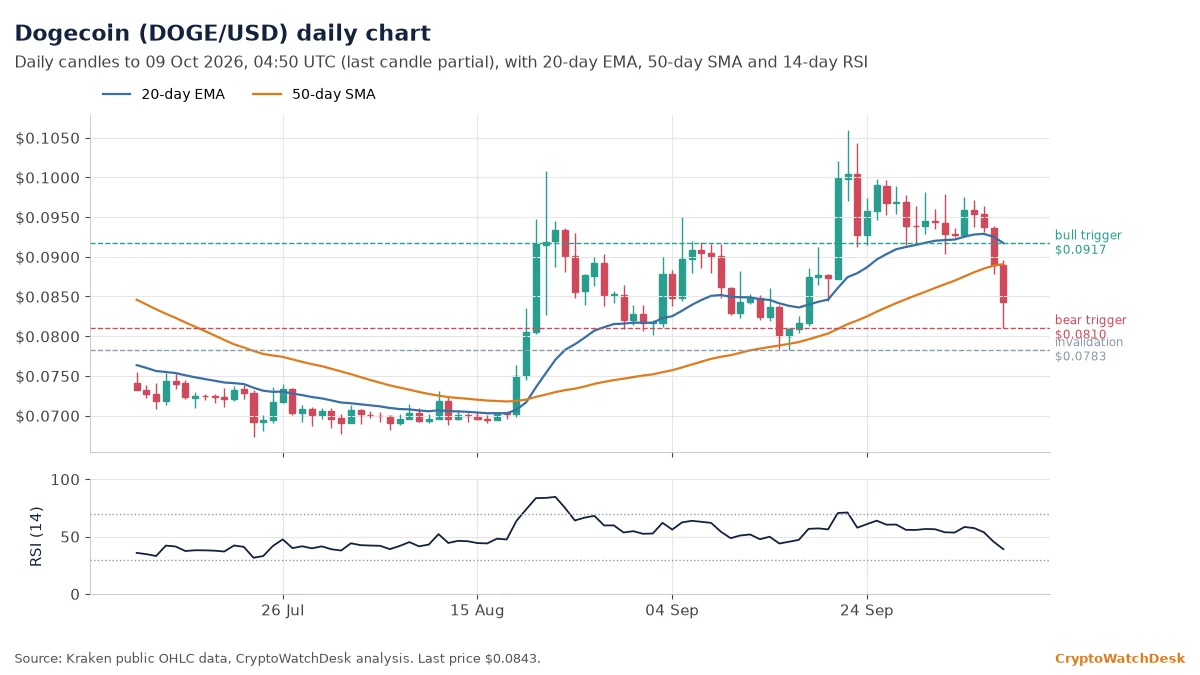
Dogecoin traded near $0.0843, below its 20-day EMA at $0.0917 and below its 50-day SMA at $0.0891. The RSI reads 39.1, a soft momentum reading.
If buyers push and hold above the 20-day EMA at $0.0917, the price could climb toward the 30-day high at $0.1059. A daily close below the 24-hour low at $0.0810 would open the way to the 30-day low at $0.0783. The bullish reading is invalidated below $0.0783.
Dogecoin’s 24-hour range ran from $0.0810 to $0.0884, about 9.0%. It sits about 20% below its 30-day high of $0.1059 and about 4% below its 200-day SMA at $0.0877.
Cardano price analysis
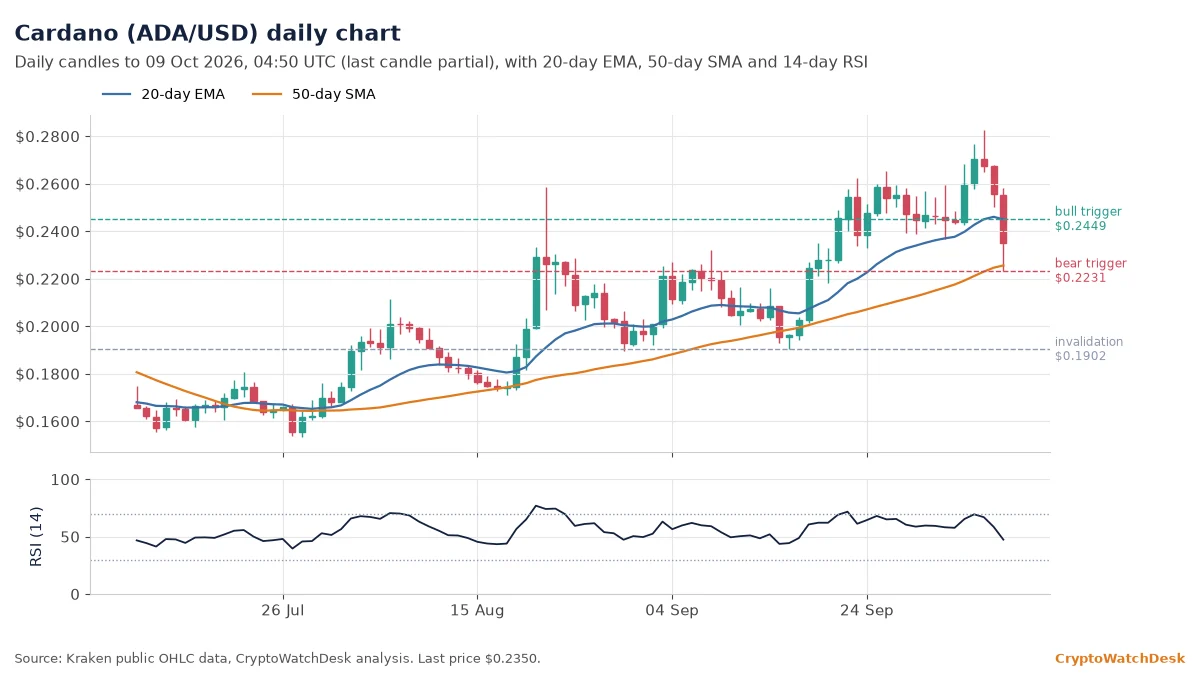
Cardano changed hands near $0.2350. That puts it below the 20-day EMA ($0.2449) and 4% above the 50-day SMA ($0.2255). The RSI stands at 47.4, which shows neither side in control.
If buyers push and hold above the 20-day EMA at $0.2449, the price could extend toward the 30-day high at $0.2825. A daily close below the 24-hour low at $0.2231 would bring the 30-day low at $0.1902 into play. The constructive structure is invalidated below $0.1902.
Over the past 24 hours Cardano moved between $0.2231 and $0.2555, a 14.5% range. The 30-day high of $0.2825 is about 17% away, and price is about 10% above its 200-day SMA at $0.2130.
Yesterday’s levels: how they held: Thursday’s map treated a daily close below $80,277 as the threat to bitcoin’s 50-day average; Thursday’s official low was $80,328.6 and the daily close was $81,683.8, so the average held on a closing basis even as intraday price tagged it. Ether’s $2,405 low stayed above the $2,356 thirty-day floor.
Technical levels are probabilistic and are often wrong. Do your own research; never trade with money you can’t afford to lose.
Related: Coin Levels 8 Oct
This article is for information only and is not investment advice.