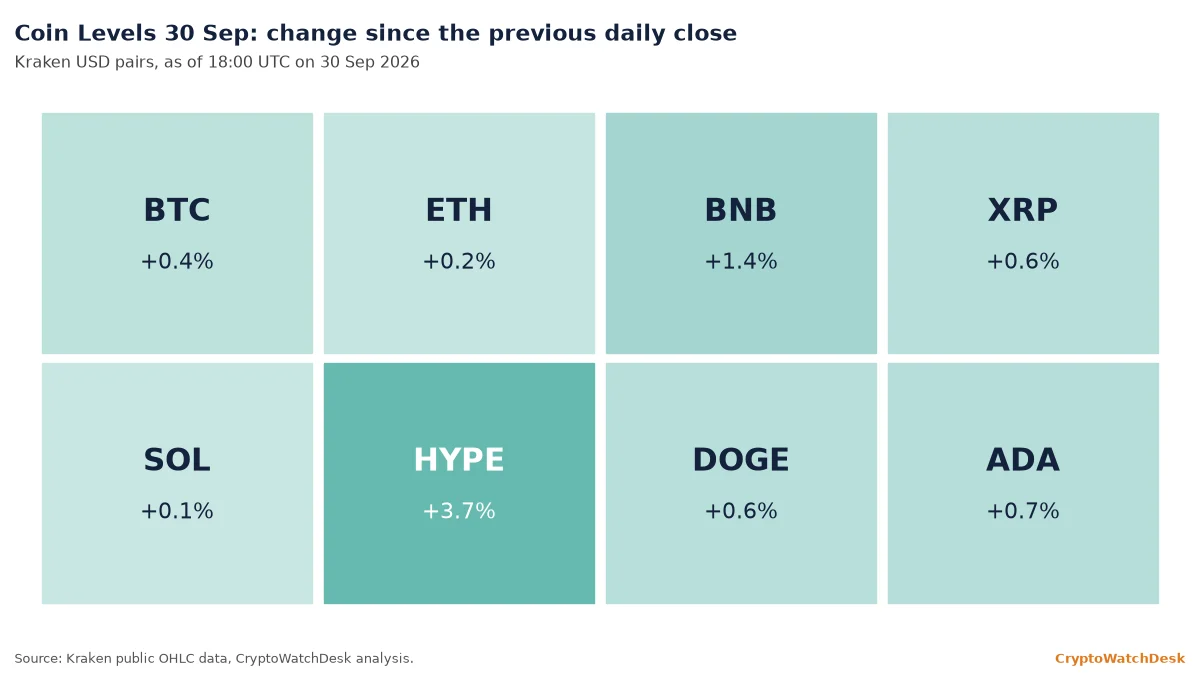
Coin Levels is scenario analysis, not investment advice. Prices as of 18:00 UTC.
Coin Levels 30 Sep: market context
The inflation data was friendlier than expected. The PCE price index rose 3.4% in the year to August against forecasts of 3.7%, and the core measure rose 3.0% against 3.3%, according to the Bureau of Economic Analysis, with forecasts as reported by CoinDesk and The Hill. Bitcoin jumped to $85,604 on Kraken after the 12:30 UTC release and gave the move back within hours. It traded near $83,987 at 18:00 UTC, up 0.4% on the day.
Bond yields explain the fade. The US 10-year Treasury yield was about 5.24% around the release and climbed to about 5.30% by the US afternoon, according to Yahoo Finance’s ^TNX series. That is close to its highest level in almost two decades. Funding on Deribit’s bitcoin perpetual rose to about 0.004% per eight hours, and DVOL held near 35.2, according to Deribit’s public data.
Spot ETF demand was positive but small going into the print. US spot bitcoin ETFs took in $66.2 million on Tuesday, led by $51.1 million into IBIT and $33.2 million into ARK’s ARKB, according to Farside Investors. Ether funds lost $2.8 million. Wednesday is also the last trading day of the third quarter.
All indicators use Kraken daily closes through 29 Sep. The 20-day exponential moving average (EMA) weights recent prices more heavily; the 50-day simple moving average (SMA) is a plain average of 50 closes; the relative strength index (RSI) is a 0-100 momentum gauge.
Bitcoin price analysis
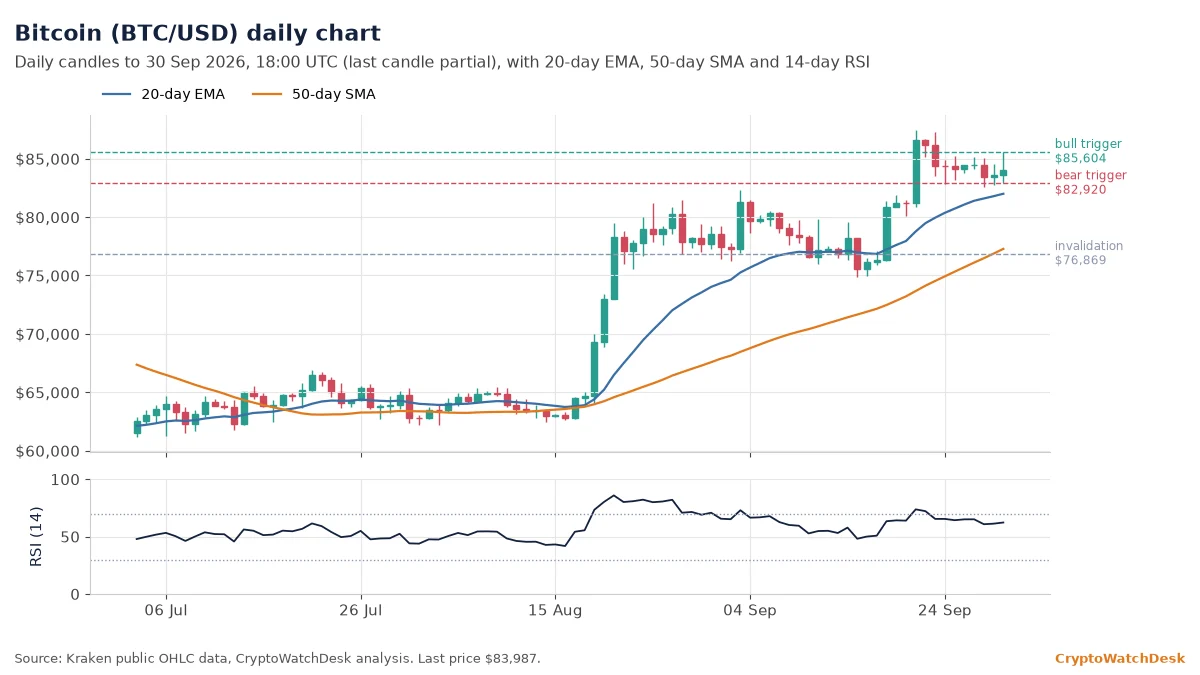
Bitcoin traded near $83,987, above its 20-day EMA at $81,787 and above its 50-day SMA at $76,869. The RSI reads 61.3, a firm but not overheated reading.
If buyers push and hold above the 24-hour high at $85,604, the price could climb toward the 30-day high at $87,447. A daily close below the 24-hour low at $82,920 would open the way to the 50-day SMA at $76,869. The bullish reading is invalidated below $76,869.
Bitcoin’s 24-hour range ran from $82,920 to $85,604, about 3.2%. It sits about 4% below its 30-day high of $87,447 and about 18% above its 200-day SMA at $71,202.
Ether price analysis
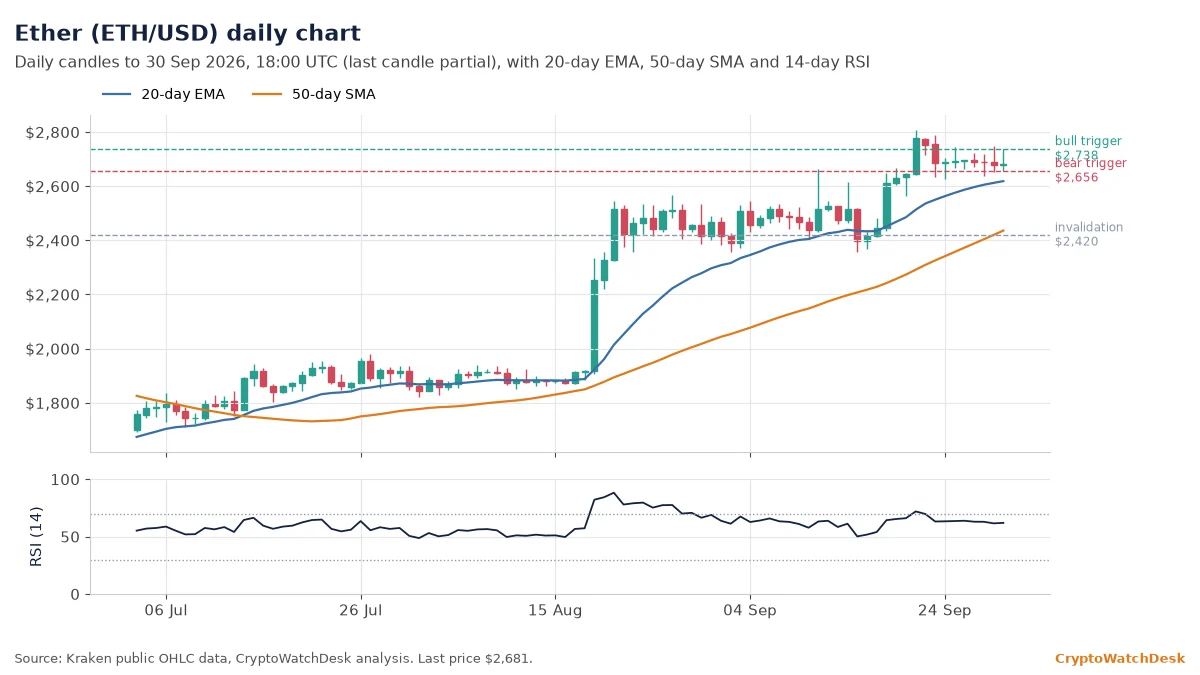
Ether changed hands near $2,681. That puts it above the 20-day EMA ($2,612) and 11% above the 50-day SMA ($2,420). The RSI stands at 61.6, a firm but not overheated reading.
If buyers push and hold above the 24-hour high at $2,738, the price could extend toward the 30-day high at $2,807. A daily close below the 24-hour low at $2,656 would bring the 50-day SMA at $2,420 into play. The constructive structure is invalidated below $2,420.
Over the past 24 hours Ether moved between $2,656 and $2,738, a 3.1% range. The 30-day high of $2,807 is about 4% away, and price is about 27% above its 200-day SMA at $2,107.
BNB price analysis
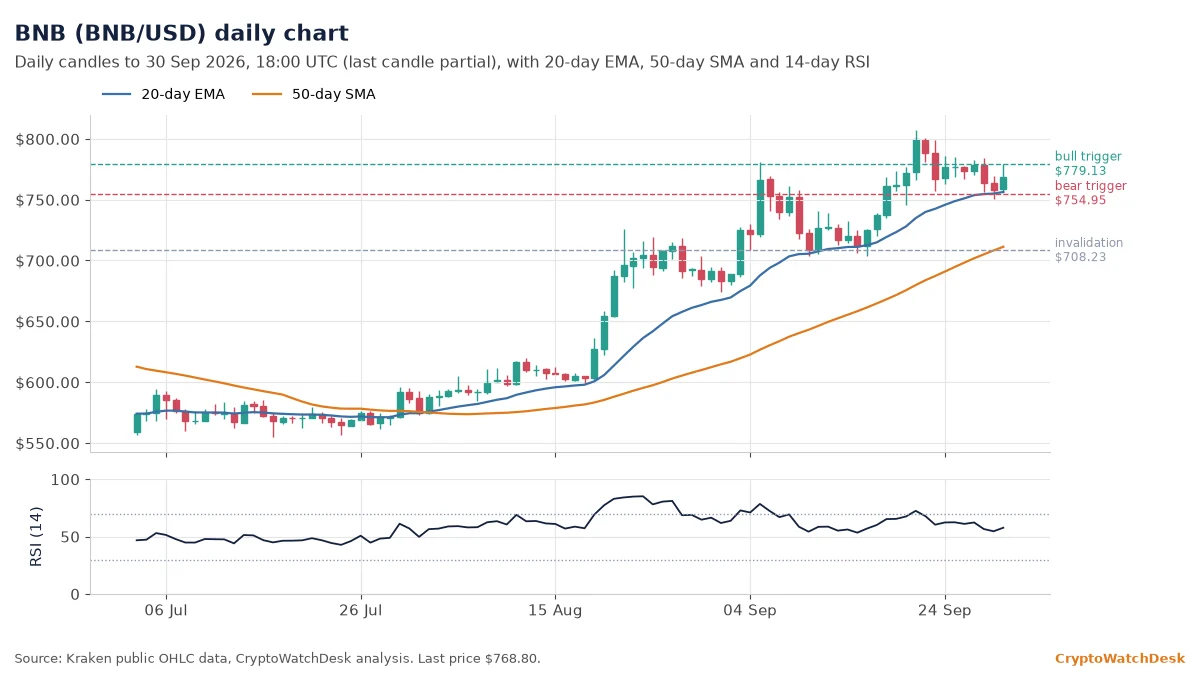
At $768.80, BNB sits above its 20-day EMA of $754.95, with the 50-day SMA at $708.23. The RSI is 54.7, which shows neither side in control.
If buyers push and hold above the 24-hour high at $779.13, the next stop is the 30-day high at $807.14. A daily close below the 20-day EMA at $754.95 would open the way to the 50-day SMA at $708.23. Below $708.23, the bullish case no longer holds.
The 24-hour range was $751.48 to $779.13 (3.7%). BNB is about 5% below its 30-day high of $807.14 and about 21% above its 200-day SMA at $635.30.
XRP price analysis
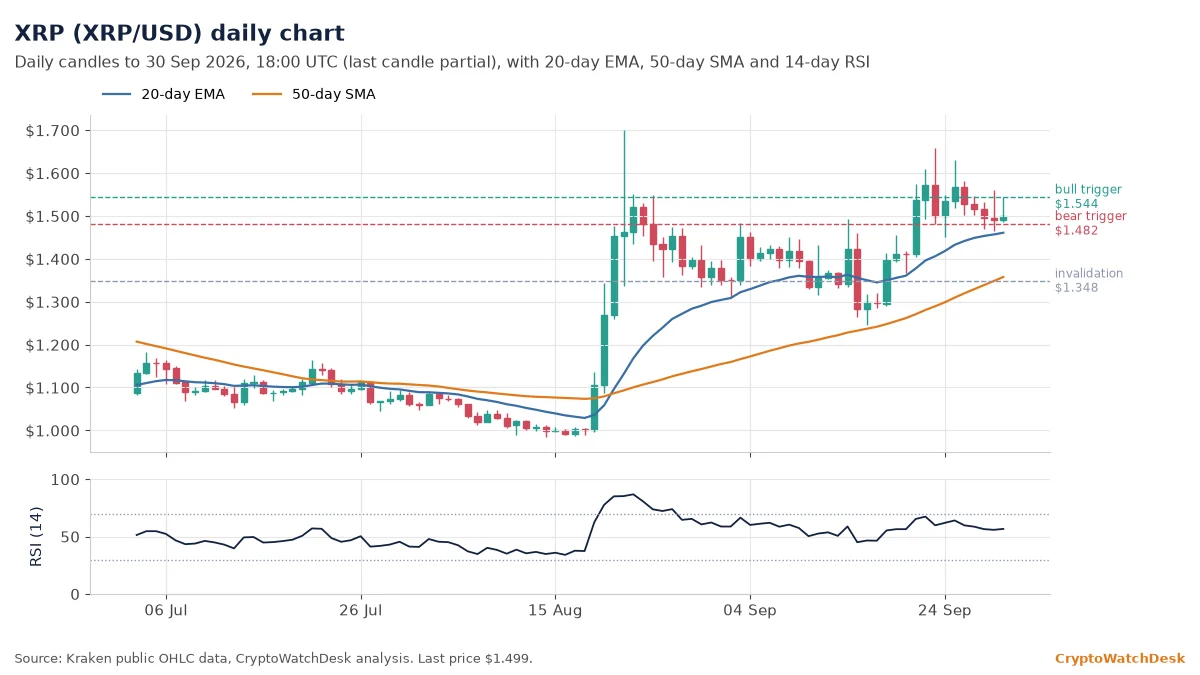
XRP traded near $1.499, above its 20-day EMA at $1.457 and above its 50-day SMA at $1.348. The RSI reads 55.9, which shows neither side in control.
If buyers push and hold above the 24-hour high at $1.544, the price could climb toward the 30-day high at $1.658. A daily close below the 24-hour low at $1.482 would open the way to the 50-day SMA at $1.348. The bullish reading is invalidated below $1.348.
XRP’s 24-hour range ran from $1.482 to $1.544, about 4.2%. It sits about 10% below its 30-day high of $1.658 and about 17% above its 200-day SMA at $1.279.
Solana price analysis
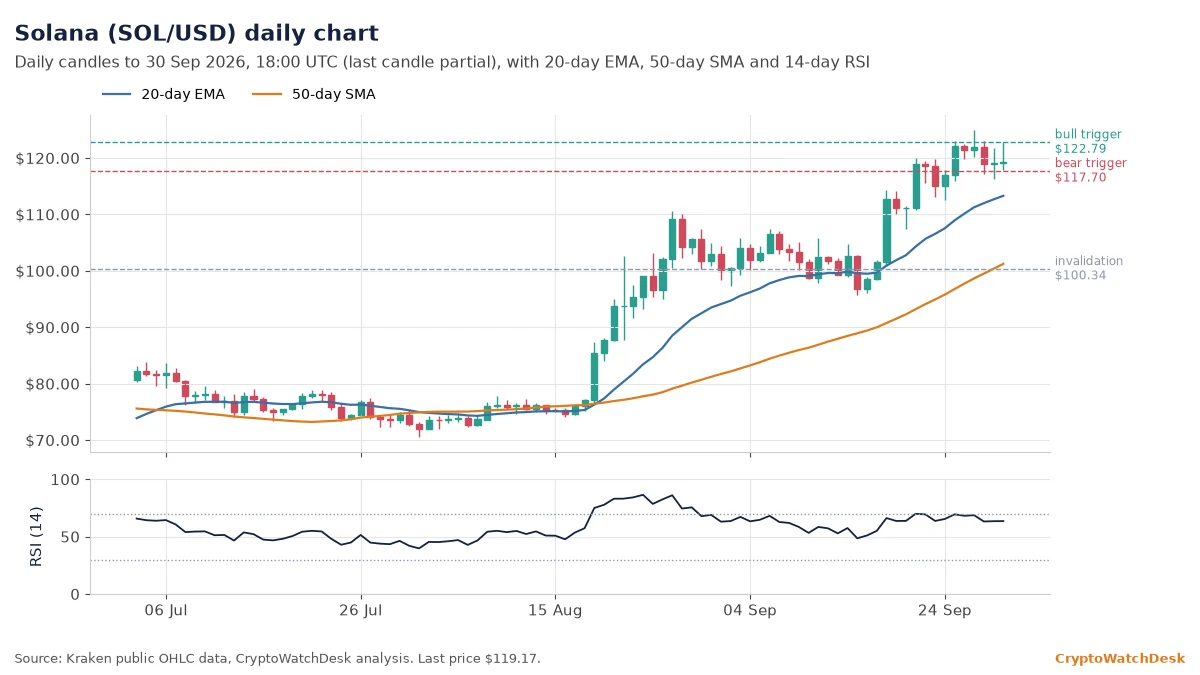
Solana changed hands near $119.17. That puts it above the 20-day EMA ($112.64) and 19% above the 50-day SMA ($100.34). The RSI stands at 63.5, a firm but not overheated reading.
If buyers push and hold above the 24-hour high at $122.79, the price could extend toward the 30-day high at $124.91. A daily close below the 24-hour low at $117.70 would bring the 50-day SMA at $100.34 into play. The constructive structure is invalidated below $100.34.
Over the past 24 hours Solana moved between $117.70 and $122.79, a 4.3% range. The 30-day high of $124.91 is about 5% away, and price is about 40% above its 200-day SMA at $85.28.
Hyperliquid price analysis
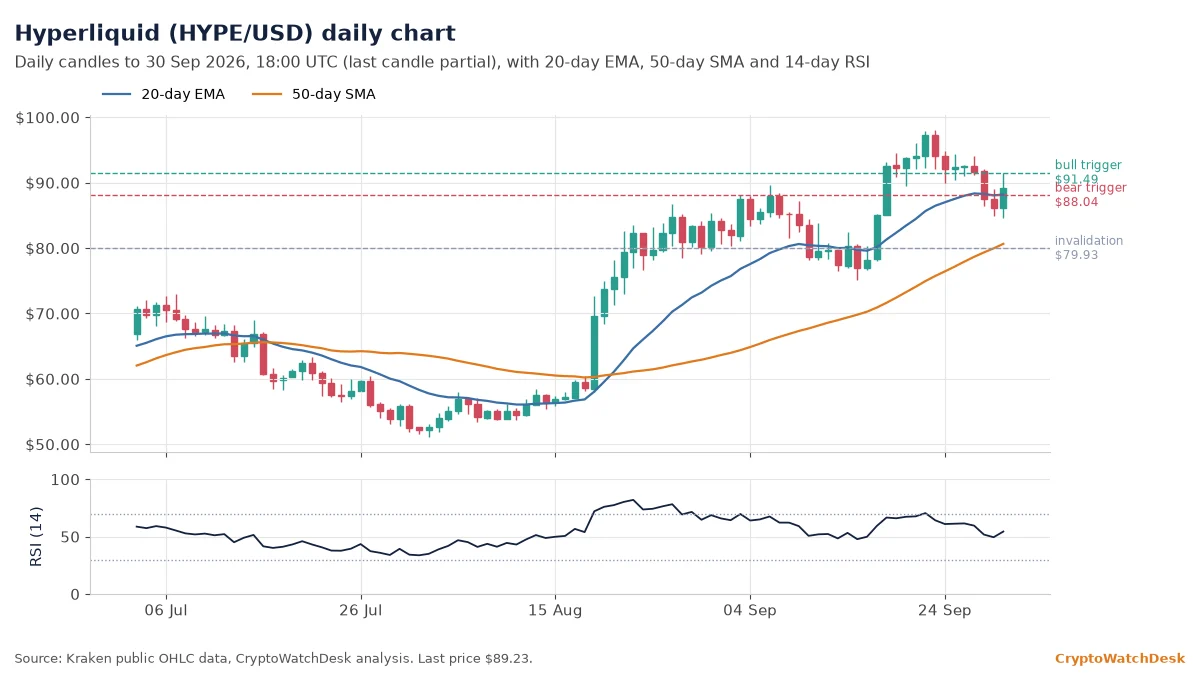
At $89.23, Hyperliquid sits just above its 20-day EMA of $88.04, with the 50-day SMA at $79.93. The RSI is 49.5, which shows neither side in control.
If buyers push and hold above the 24-hour high at $91.49, the next stop is the 30-day high at $98.02. A daily close below the 20-day EMA at $88.04 would open the way to the 50-day SMA at $79.93. Below $79.93, the bullish case no longer holds.
The 24-hour range was $84.62 to $91.49 (8.1%). Hyperliquid is about 9% below its 30-day high of $98.02 and about 50% above its 200-day SMA at $59.45.
Dogecoin price analysis
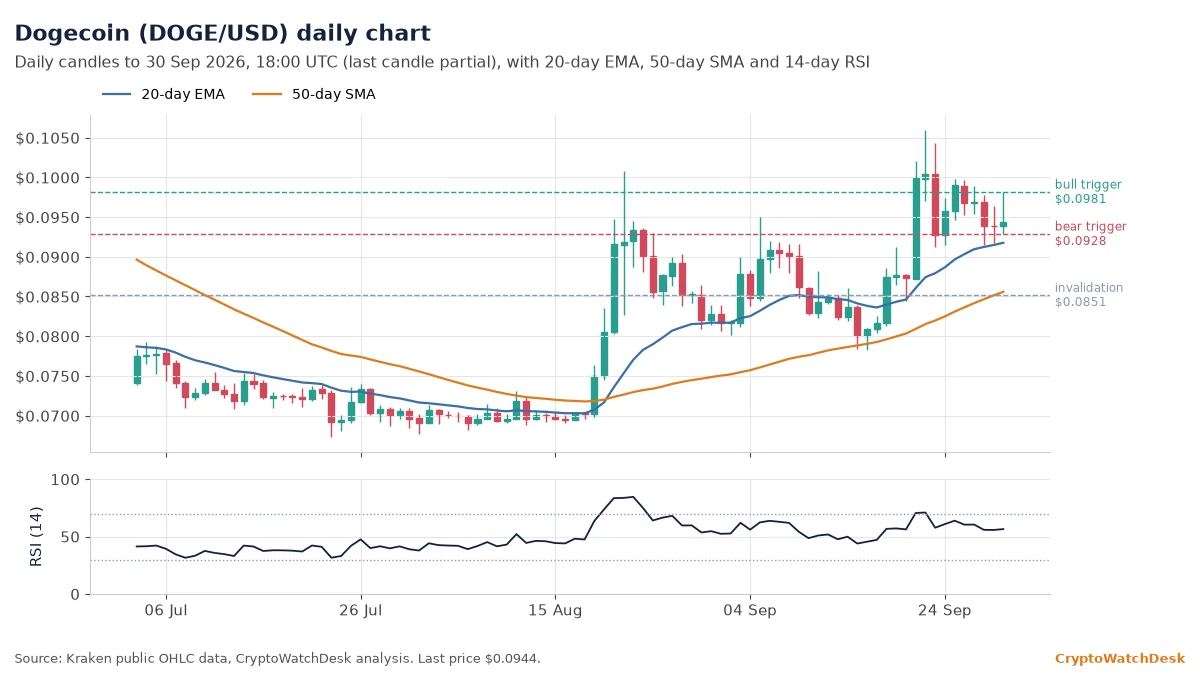
Dogecoin traded near $0.0944, above its 20-day EMA at $0.0915 and above its 50-day SMA at $0.0851. The RSI reads 55.8, which shows neither side in control.
If buyers push and hold above the 24-hour high at $0.0981, the price could climb toward the 30-day high at $0.1059. A daily close below the 24-hour low at $0.0928 would open the way to the 50-day SMA at $0.0851. The bullish reading is invalidated below $0.0851.
Dogecoin’s 24-hour range ran from $0.0928 to $0.0981, about 5.7%. It sits about 11% below its 30-day high of $0.1059 and about 7% above its 200-day SMA at $0.0879.
Cardano price analysis
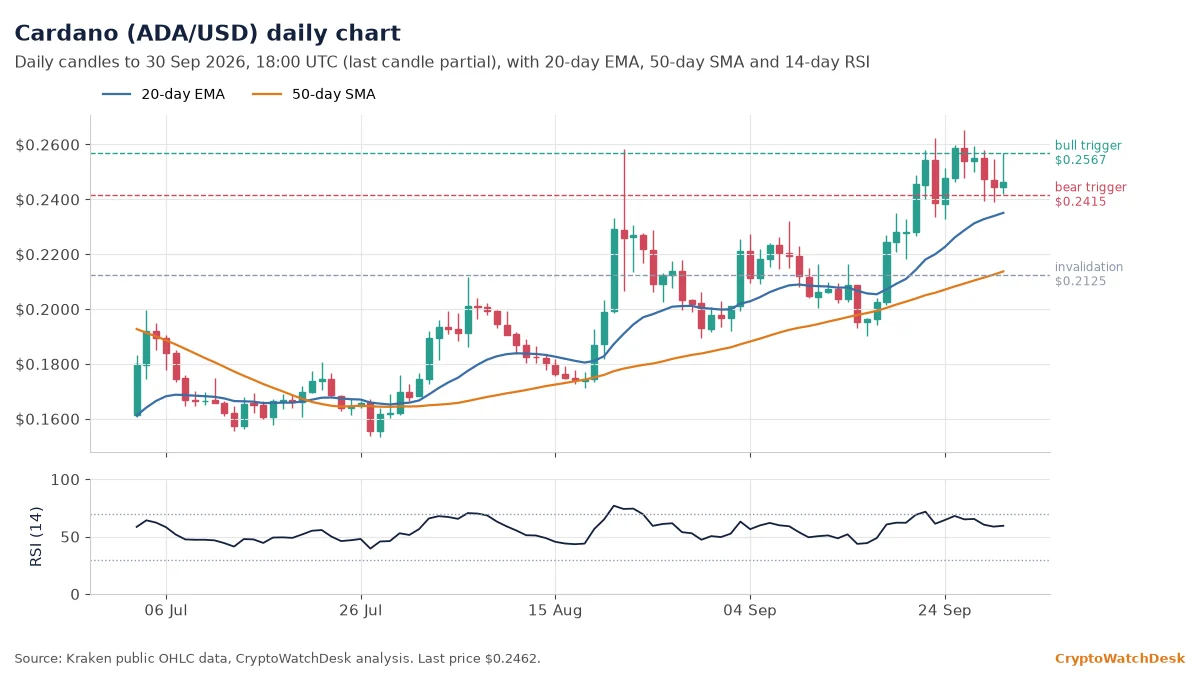
Cardano changed hands near $0.2462. That puts it above the 20-day EMA ($0.2338) and 16% above the 50-day SMA ($0.2125). The RSI stands at 58.7, which shows neither side in control.
If buyers push and hold above the 24-hour high at $0.2567, the price could extend toward the 30-day high at $0.2652. A daily close below the 24-hour low at $0.2415 would bring the 50-day SMA at $0.2125 into play. The constructive structure is invalidated below $0.2125.
Over the past 24 hours Cardano moved between $0.2415 and $0.2567, a 6.3% range. The 30-day high of $0.2652 is about 7% away, and price is about 15% above its 200-day SMA at $0.2138.
Yesterday’s levels: how they held: The previous map’s bitcoin bull trigger at $84,527 was reached, and the bear trigger at $82,735 held (low $82,920), although the move above the trigger did not survive to a daily close.
Technical levels are probabilistic and are often wrong. Do your own research; never trade with money you can’t afford to lose.
Produced by the Crypto Watch Desk newsroom using AI tools. This article is for information only and is not investment advice.