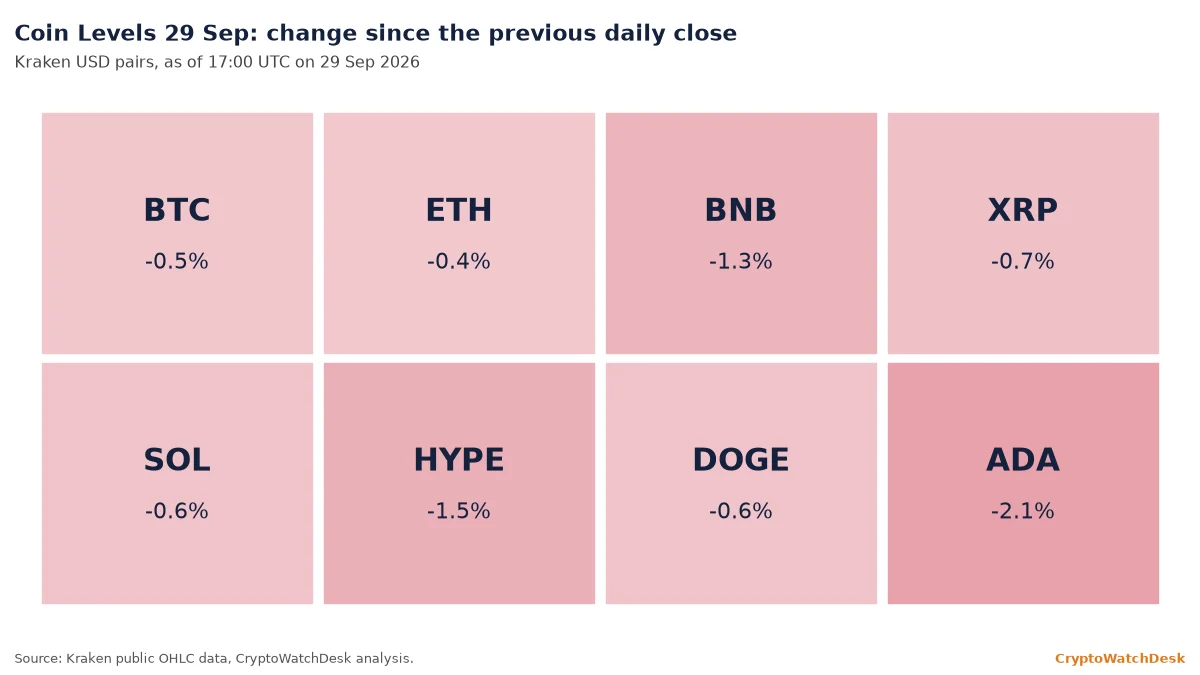
Coin Levels is scenario analysis, not investment advice. Prices as of 17:00 UTC.
Coin Levels 29 Sep: market context
Tuesday was a waiting day. Bitcoin moved between $82,735 and $84,527 on Kraken over the 24 hours to 17:00 UTC and traded near $83,033, down 0.5% from Monday’s close. Monday’s $82,566 low was not retested.
Related: Joaquín’s read on the range
The spot bid thinned. US spot bitcoin ETFs took in a net $31.0 million on Monday, with $54.8 million into BlackRock’s IBIT partly offset by $23.2 million out of Grayscale’s GBTC and $10.9 million out of Fidelity’s FBTC, according to Farside Investors. Ether funds added $17.1 million and Solana funds $7.7 million, according to Farside’s ether and Solana tables.
Related: ETF Desk on Monday’s flows
Derivatives were quiet. Funding on Deribit’s bitcoin perpetual was about 0.001% per eight hours at 17:00 UTC, and DVOL, Deribit’s 30-day implied volatility index, eased to about 35.0 from 35.8 a day earlier, according to Deribit’s public data. The next scheduled catalyst is the US personal consumption expenditures (PCE) price index for August, due at 12:30 UTC on Wednesday.
All indicators use Kraken daily closes through 28 Sep. The 20-day exponential moving average (EMA) weights recent prices more heavily; the 50-day simple moving average (SMA) is a plain average of 50 closes; the relative strength index (RSI) is a 0-100 momentum gauge.
Bitcoin price analysis
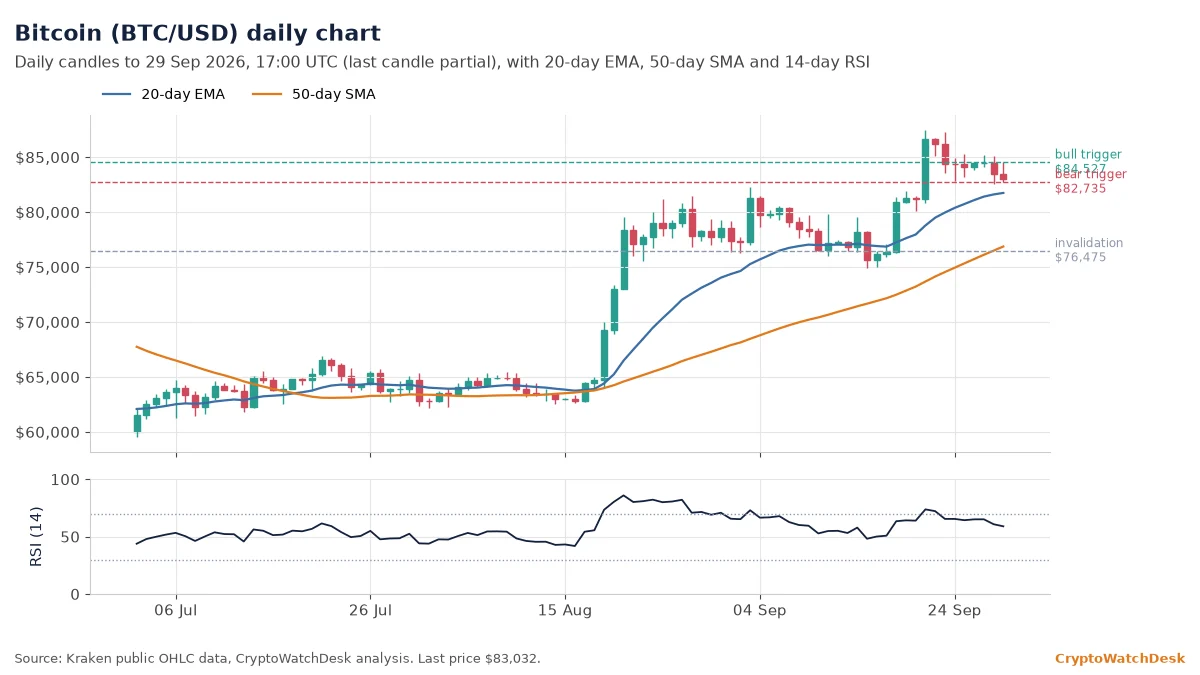
Bitcoin traded near $83,032, above its 20-day EMA at $81,592 and above its 50-day SMA at $76,475. The RSI reads 60.8, a firm but not overheated reading.
If buyers push and hold above the 24-hour high at $84,527, the price could climb toward the 30-day high at $87,447. A daily close below the 24-hour low at $82,735 would open the way to the 50-day SMA at $76,475. The bullish reading is invalidated below $76,475.
Bitcoin’s 24-hour range ran from $82,735 to $84,527, about 2.2%. It sits about 5% below its 30-day high of $87,447 and about 17% above its 200-day SMA at $71,139.
Ether price analysis
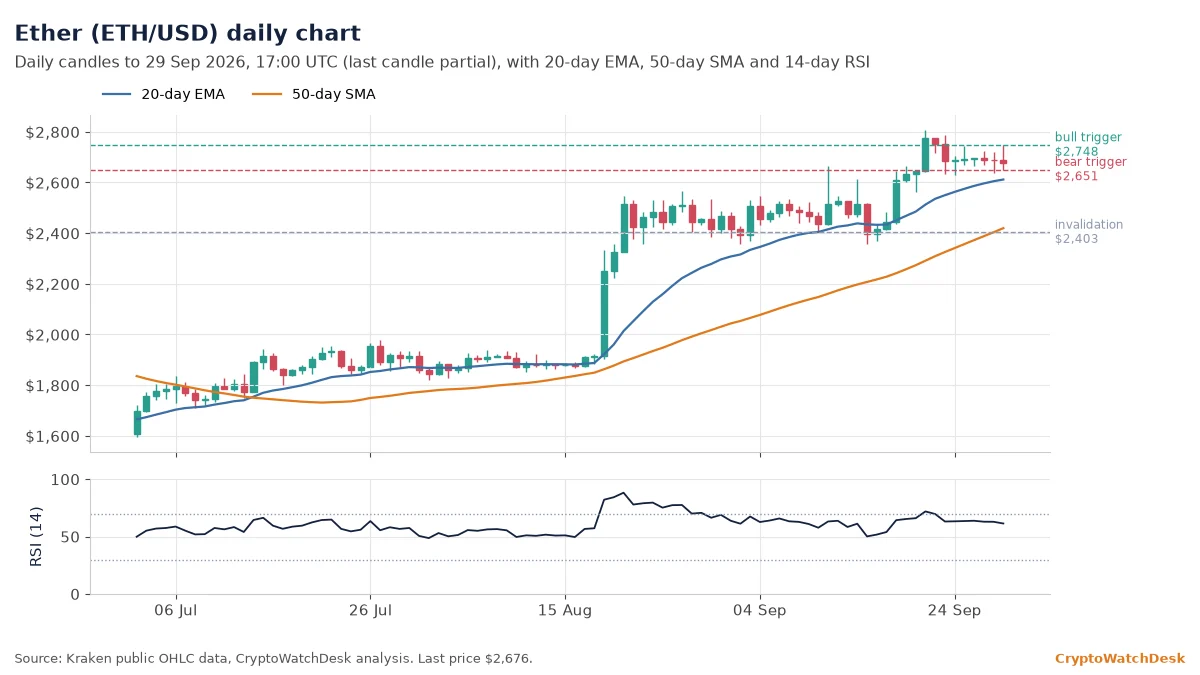
Ether changed hands near $2,676. That puts it above the 20-day EMA ($2,605) and 11% above the 50-day SMA ($2,403). The RSI stands at 62.9, a firm but not overheated reading.
If buyers push and hold above the 24-hour high at $2,748, the price could extend toward the 30-day high at $2,807. A daily close below the 24-hour low at $2,651 would bring the 50-day SMA at $2,403 into play. The constructive structure is invalidated below $2,403.
Over the past 24 hours Ether moved between $2,651 and $2,748, a 3.7% range. The 30-day high of $2,807 is about 5% away, and price is about 27% above its 200-day SMA at $2,104.
BNB price analysis
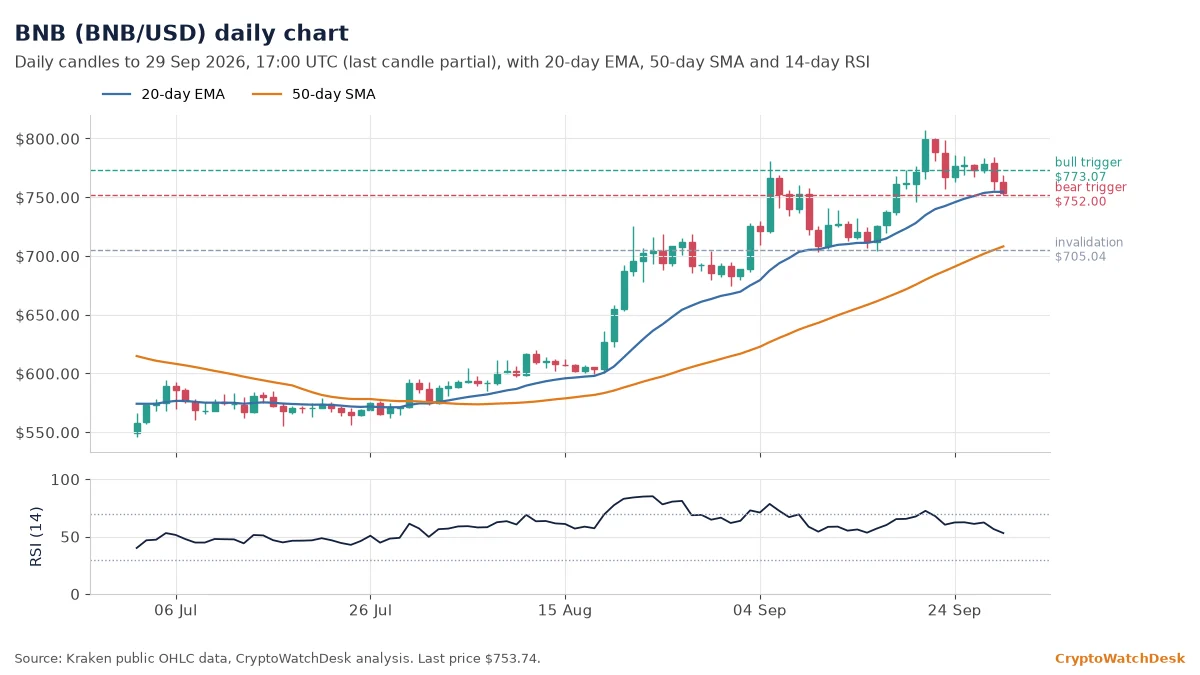
At $753.74, BNB sits almost exactly on its 20-day EMA of $754.60, with the 50-day SMA at $705.04. The RSI is 56.6, which shows neither side in control.
If buyers push and hold above the 24-hour high at $773.07, the next stop is the 30-day high at $807.14. A daily close below the 24-hour low at $752.00 would open the way to the 50-day SMA at $705.04. Below $705.04, the bullish case no longer holds.
The 24-hour range was $752.00 to $773.07 (2.8%). BNB is about 7% below its 30-day high of $807.14 and about 19% above its 200-day SMA at $634.79.
XRP price analysis
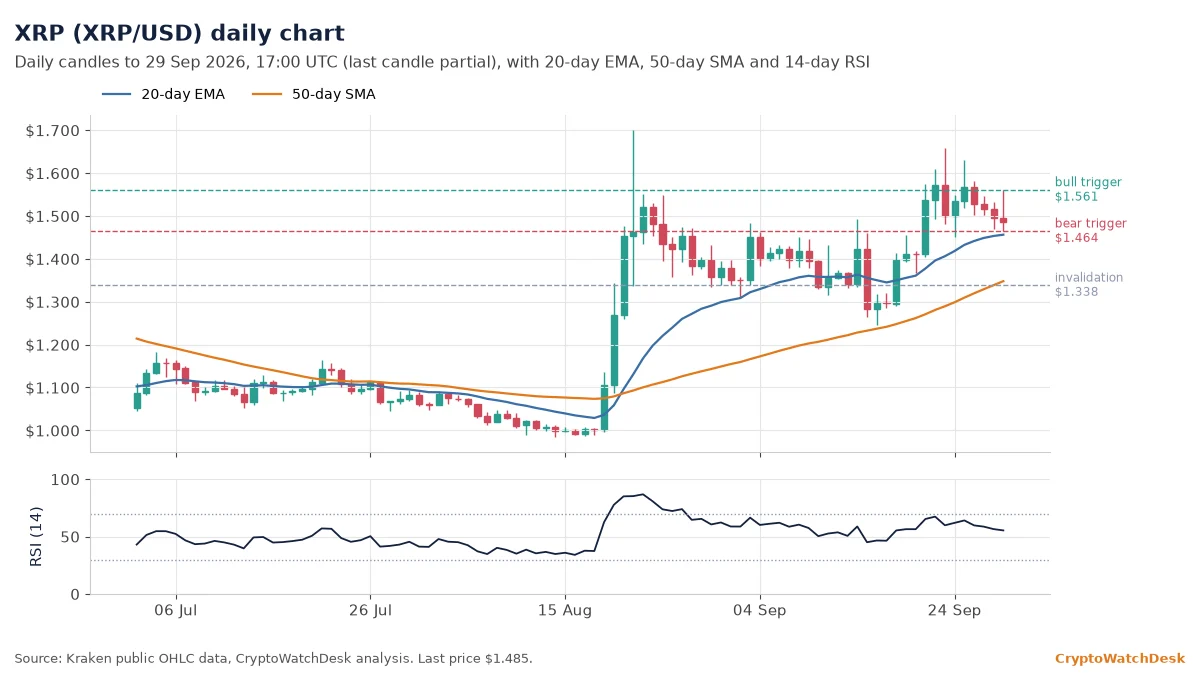
XRP traded near $1.485, above its 20-day EMA at $1.453 and above its 50-day SMA at $1.338. The RSI reads 56.6, which shows neither side in control.
If buyers push and hold above the 24-hour high at $1.561, the price could climb toward the 30-day high at $1.658. A daily close below the 24-hour low at $1.464 would open the way to the 50-day SMA at $1.338. The bullish reading is invalidated below $1.338.
XRP’s 24-hour range ran from $1.464 to $1.561, about 6.6%. It sits about 10% below its 30-day high of $1.658 and about 16% above its 200-day SMA at $1.279.
Solana price analysis
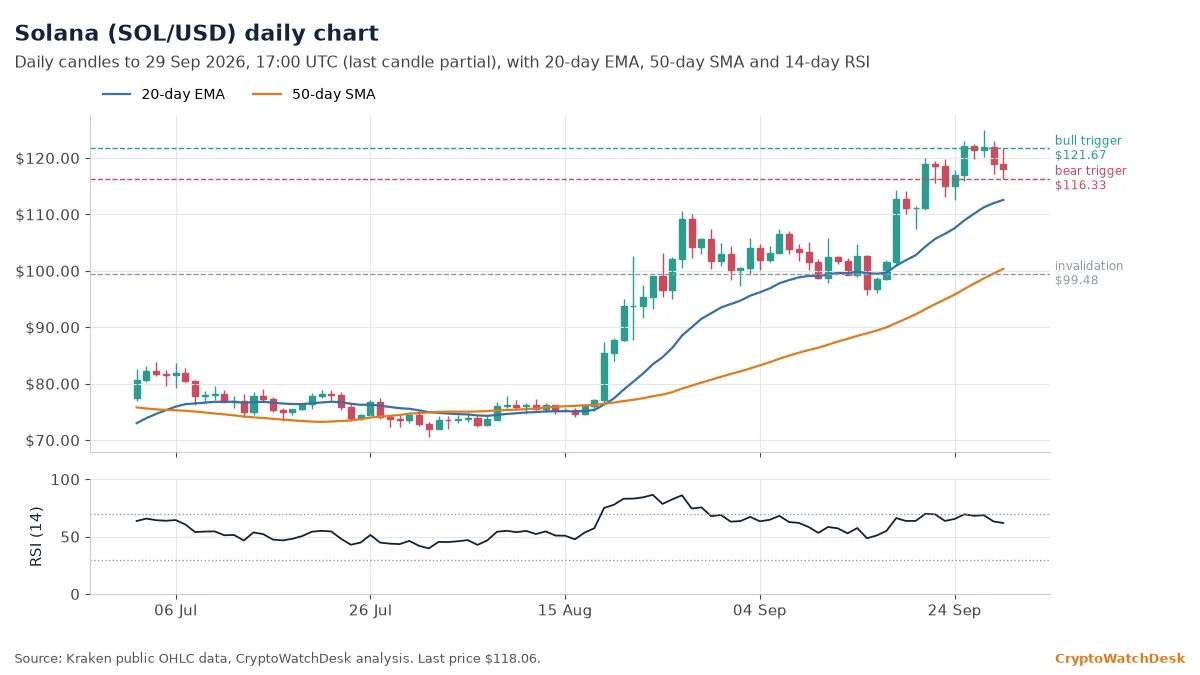
Solana changed hands near $118.06. That puts it above the 20-day EMA ($111.96) and 19% above the 50-day SMA ($99.48). The RSI stands at 63.2, a firm but not overheated reading.
If buyers push and hold above the 24-hour high at $121.67, the price could extend toward the 30-day high at $124.91. A daily close below the 24-hour low at $116.33 would bring the 50-day SMA at $99.48 into play. The constructive structure is invalidated below $99.48.
Over the past 24 hours Solana moved between $116.33 and $121.67, a 4.6% range. The 30-day high of $124.91 is about 5% away, and price is about 39% above its 200-day SMA at $85.12.
Hyperliquid price analysis
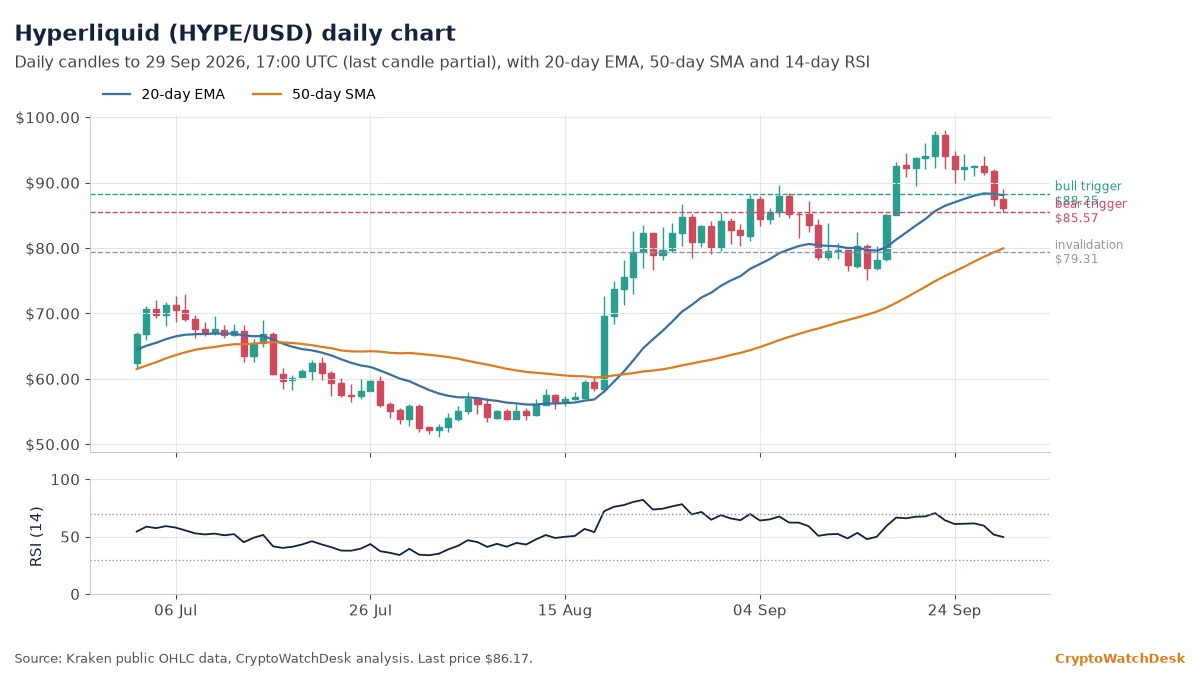
At $86.17, Hyperliquid sits below its 20-day EMA of $88.25, with the 50-day SMA at $79.31. The RSI is 51.8, which shows neither side in control.
If buyers push and hold above the 20-day EMA at $88.25, the next stop is the 30-day high at $98.02. A daily close below the 24-hour low at $85.57 would open the way to the 50-day SMA at $79.31. Below $79.31, the bullish case no longer holds.
The 24-hour range was $85.57 to $89.66 (4.8%). Hyperliquid is about 12% below its 30-day high of $98.02 and about 46% above its 200-day SMA at $59.20.
Dogecoin price analysis
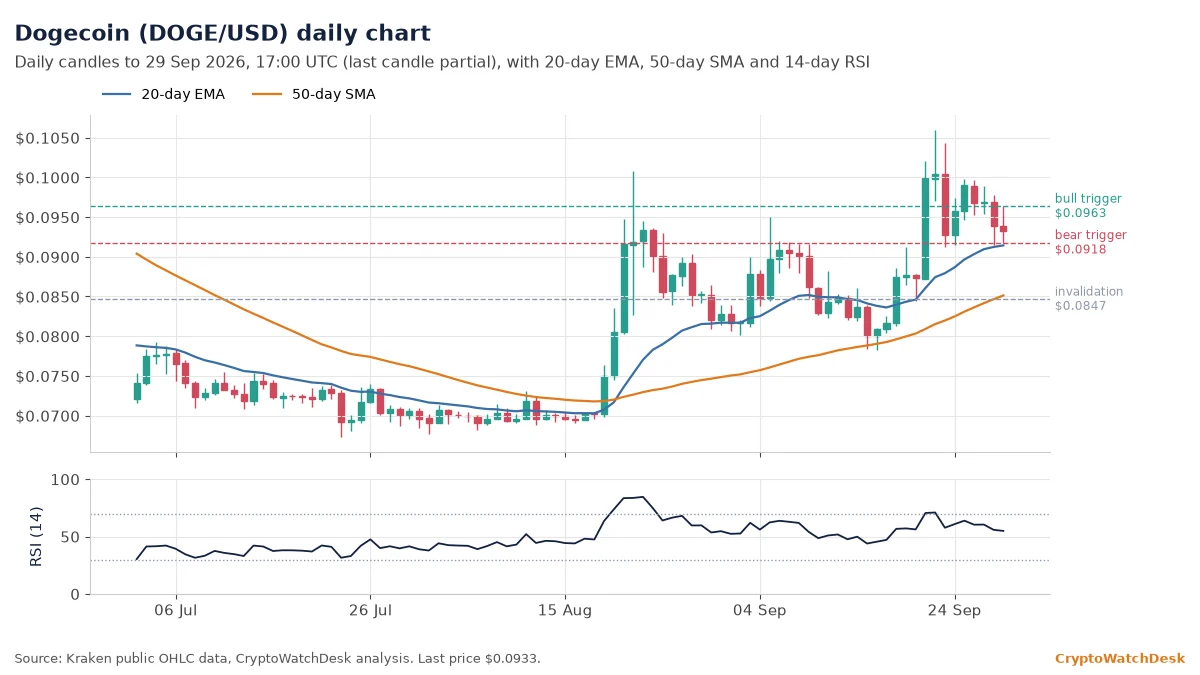
Dogecoin traded near $0.0933, above its 20-day EMA at $0.0912 and above its 50-day SMA at $0.0847. The RSI reads 55.9, which shows neither side in control.
If buyers push and hold above the 24-hour high at $0.0963, the price could climb toward the 30-day high at $0.1059. A daily close below the 24-hour low at $0.0918 would open the way to the 50-day SMA at $0.0847. The bullish reading is invalidated below $0.0847.
Dogecoin’s 24-hour range ran from $0.0918 to $0.0963, about 5.0%. It sits about 12% below its 30-day high of $0.1059 and about 6% above its 200-day SMA at $0.0879.
Cardano price analysis
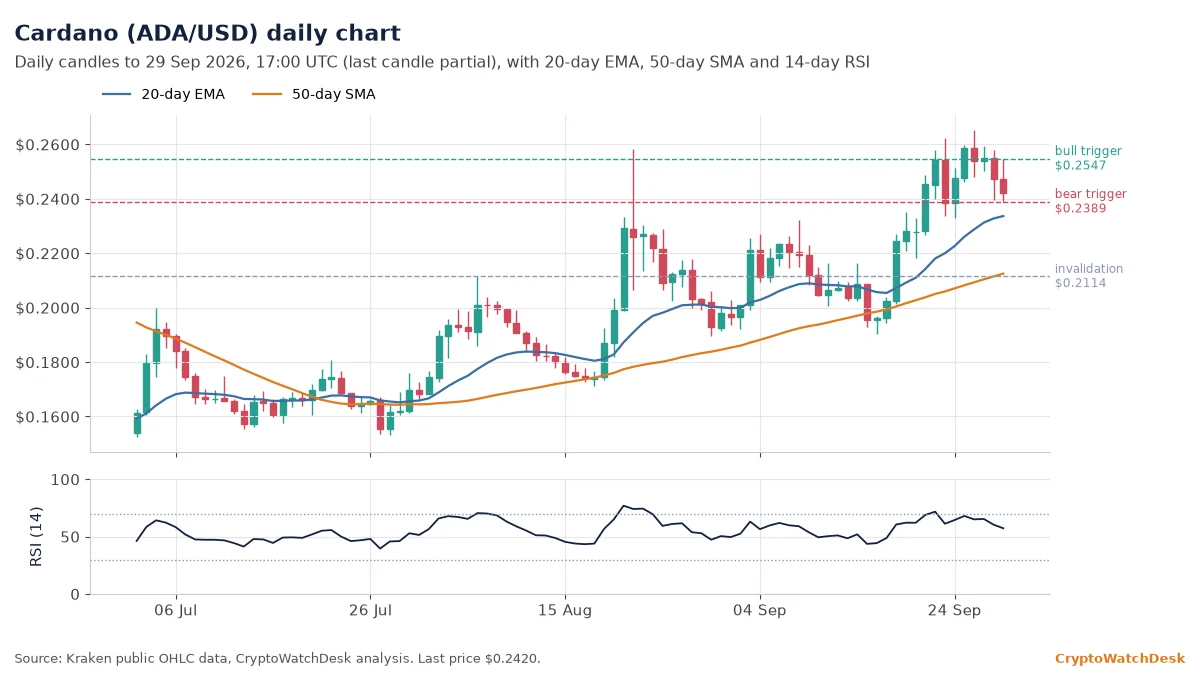
Cardano changed hands near $0.2420. That puts it above the 20-day EMA ($0.2327) and 14% above the 50-day SMA ($0.2114). The RSI stands at 60.4, a firm but not overheated reading.
If buyers push and hold above the 24-hour high at $0.2547, the price could extend toward the 30-day high at $0.2652. A daily close below the 24-hour low at $0.2389 would bring the 50-day SMA at $0.2114 into play. The constructive structure is invalidated below $0.2114.
Over the past 24 hours Cardano moved between $0.2389 and $0.2547, a 6.6% range. The 30-day high of $0.2652 is about 9% away, and price is about 13% above its 200-day SMA at $0.2139.
Yesterday’s levels: how they held: The previous map’s bitcoin bull trigger at $85,061 was not reached (high $84,527), and the bear trigger at $82,566 held (low $82,735).
Technical levels are probabilistic and are often wrong. Do your own research; never trade with money you can’t afford to lose.
Produced by the Crypto Watch Desk newsroom using AI tools. This article is for information only and is not investment advice.