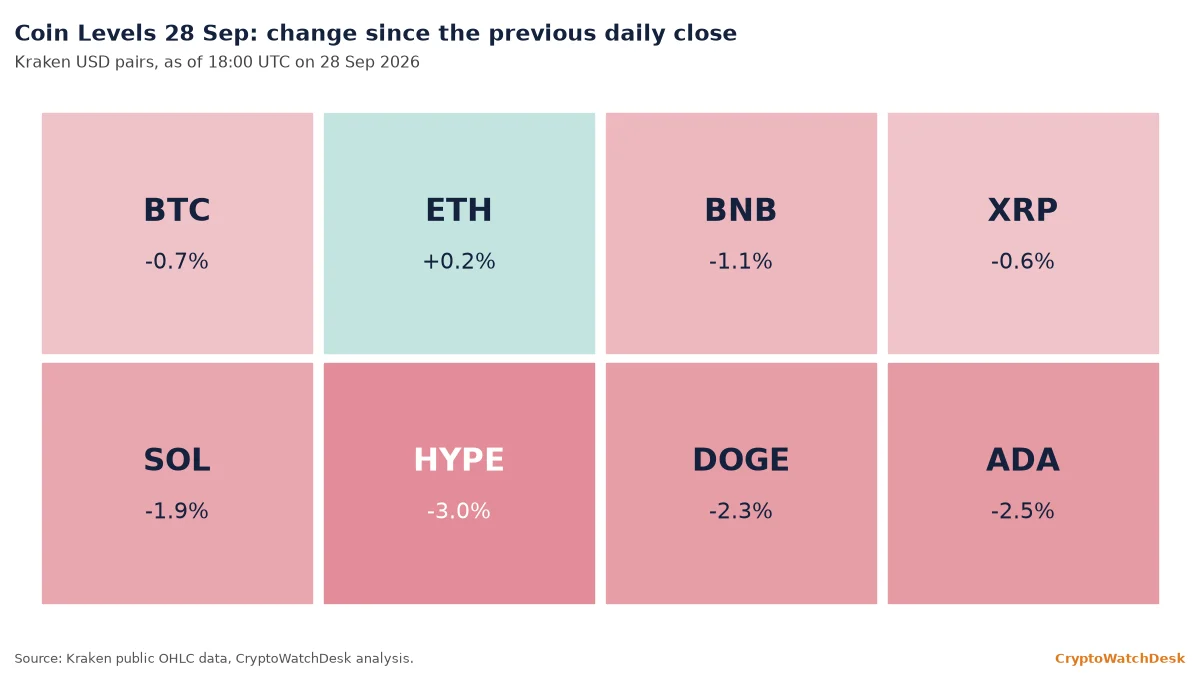
Coin Levels is scenario analysis, not investment advice. Prices as of 18:00 UTC.
Coin Levels 28 Sep: market context
Bitcoin opened the week with a brief push above $85,000 and lost it during the Asian session. The trigger was outside crypto: President Donald Trump’s rejection of an Iranian proposal tied to reopening the Strait of Hormuz pushed Brent crude back above $100 a barrel and lifted Treasury yields, according to CoinMarketCap and Cryptonews. On Kraken, bitcoin went from Sunday’s close of $84,444 to $85,061 and then down to $82,566 before steadying near $83,845 at 18:00 UTC.
Related: Joaquín’s market read for 28 Sep
Leverage took the hit. CoinGlass counted about $487 million in liquidations in the 24 hours to 16:00 UTC, 81% of them longs, according to CoinMarketCap’s reading of the data. Funding on Deribit’s bitcoin perpetual was flat at about 0.001% per eight hours at 18:00 UTC, and the exchange’s 30-day implied volatility index, DVOL, sat near 35.5, up only from about 35.1 a day earlier, according to Deribit’s public data. Options traders are not pricing a disorderly move.
Spot demand has been the cushion. US spot bitcoin ETFs took in about $2.39 billion in the week to Friday, 25 Sep, including $134.5 million on Friday itself, according to Farside Investors. Monday’s flows will not be complete until after the US close.
All indicators below use Kraken daily closes through 27 Sep. The 20-day exponential moving average (EMA) weights recent prices more heavily; the 50-day simple moving average (SMA) is a plain average of 50 closes; the relative strength index (RSI) is a 0-100 momentum gauge. Bull triggers, bear triggers and invalidation levels are marked on each chart.
Bitcoin price analysis
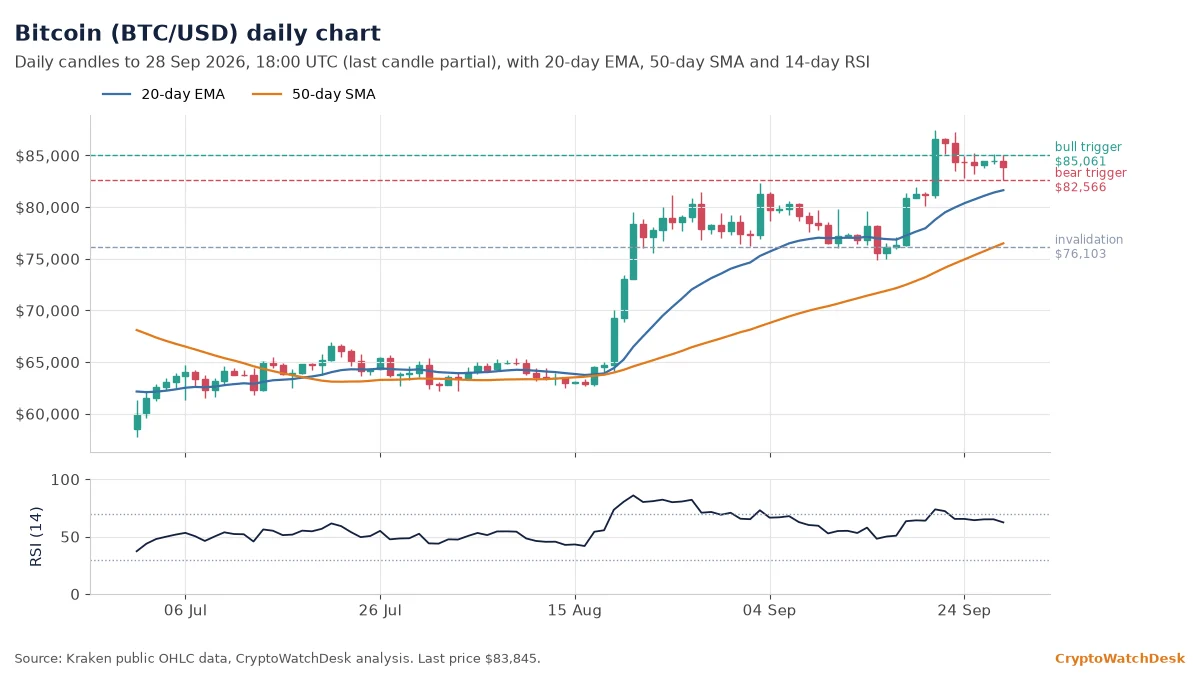
Bitcoin traded near $83,845, above its 20-day EMA at $81,395 and above its 50-day SMA at $76,103. The RSI reads 65.1, a firm but not overheated reading.
If buyers push and hold above the 24-hour high at $85,061, the price could climb toward the 30-day high at $87,447. A daily close below the 24-hour low at $82,566 would open the way to the 50-day SMA at $76,103. The bullish reading is invalidated below $76,103.
Bitcoin’s 24-hour range ran from $82,566 to $85,061, about 3.0%. It sits about 4% below its 30-day high of $87,447 and about 18% above its 200-day SMA at $71,074.
Ether price analysis
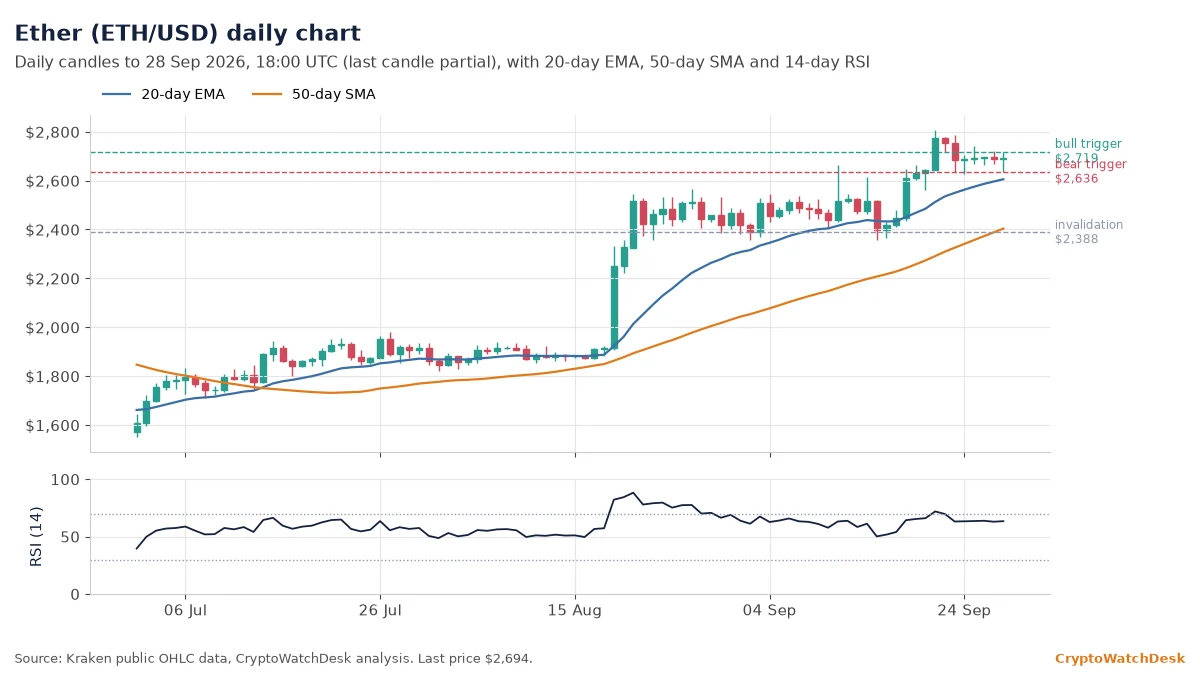
Ether changed hands near $2,694. That puts it above the 20-day EMA ($2,596) and 13% above the 50-day SMA ($2,388). The RSI stands at 63.0, a firm but not overheated reading.
If buyers push and hold above the 24-hour high at $2,719, the price could extend toward the 30-day high at $2,807. A daily close below the 24-hour low at $2,636 would bring the 50-day SMA at $2,388 into play. The constructive structure is invalidated below $2,388.
Over the past 24 hours Ether moved between $2,636 and $2,719, a 3.2% range. The 30-day high of $2,807 is about 4% away, and price is about 28% above its 200-day SMA at $2,101.
BNB price analysis
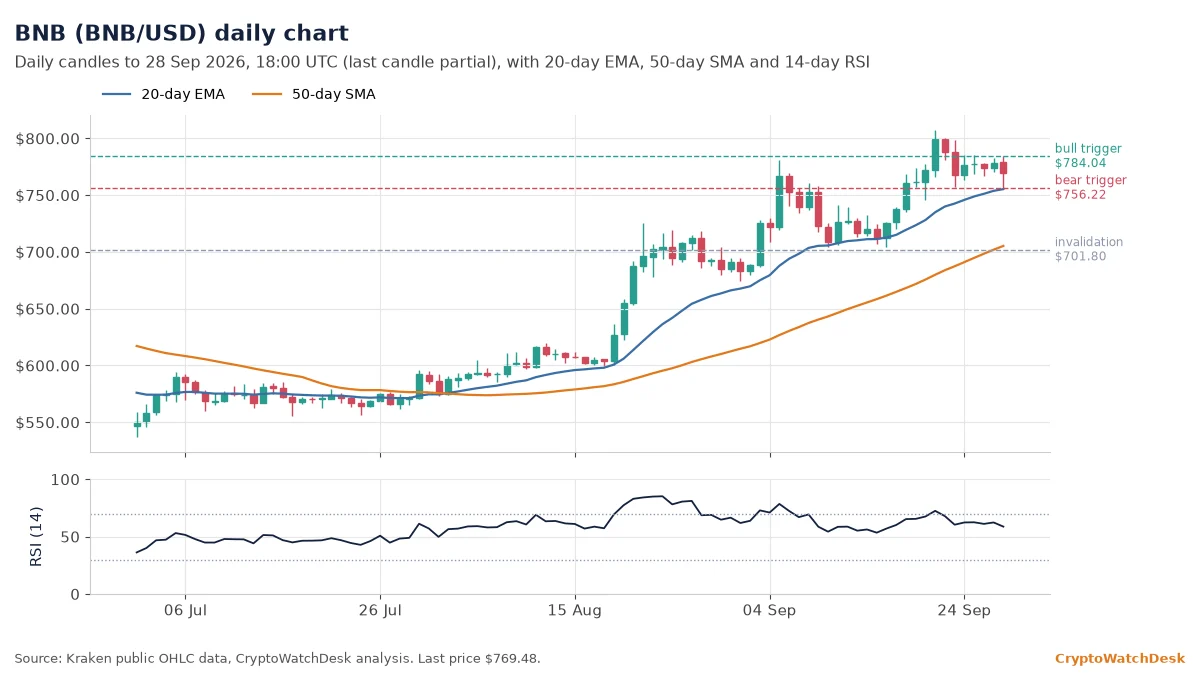
At $769.48, BNB sits above its 20-day EMA of $753.65, with the 50-day SMA at $701.80. The RSI is 62.3, a firm but not overheated reading.
If buyers push and hold above the 24-hour high at $784.04, the next stop is the 30-day high at $807.14. A daily close below the 24-hour low at $756.22 would open the way to the 50-day SMA at $701.80. Below $701.80, the bullish case no longer holds.
The 24-hour range was $756.22 to $784.04 (3.7%). BNB is about 5% below its 30-day high of $807.14 and about 21% above its 200-day SMA at $634.23.
XRP price analysis
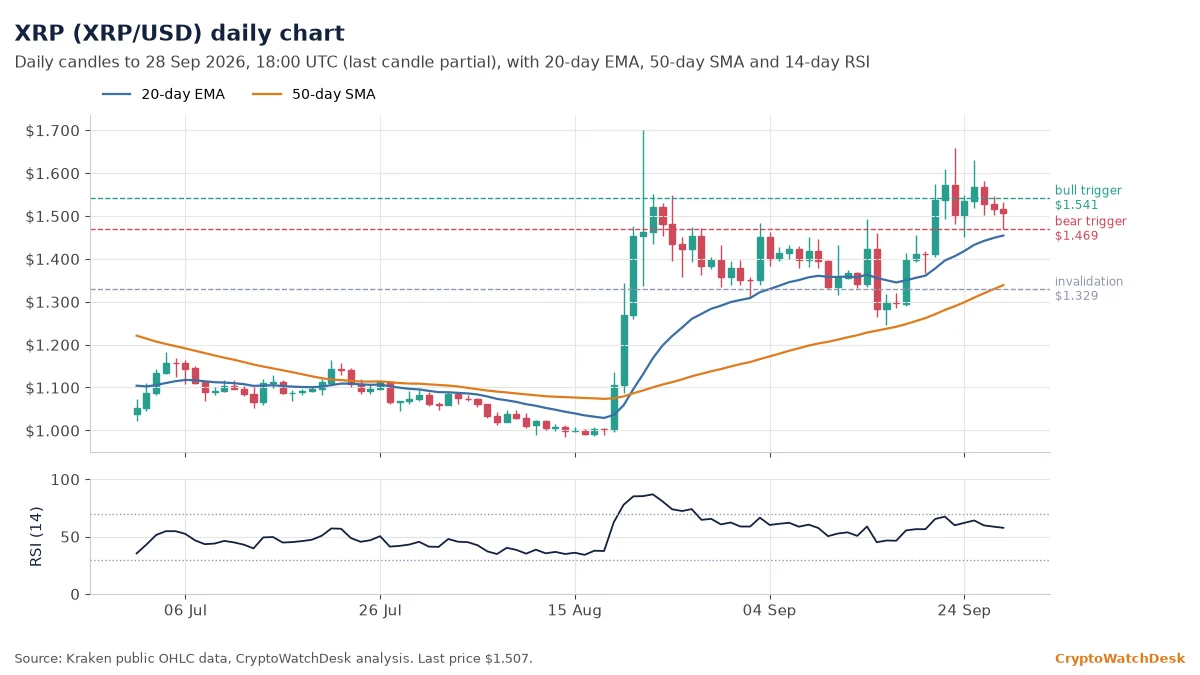
XRP traded near $1.507, above its 20-day EMA at $1.449 and above its 50-day SMA at $1.329. The RSI reads 58.7, which shows neither side in control.
If buyers push and hold above the 24-hour high at $1.541, the price could climb toward the 30-day high at $1.658. A daily close below the 24-hour low at $1.469 would open the way to the 50-day SMA at $1.329. The bullish reading is invalidated below $1.329.
XRP’s 24-hour range ran from $1.469 to $1.541, about 4.9%. It sits about 9% below its 30-day high of $1.658 and about 18% above its 200-day SMA at $1.278.
Solana price analysis
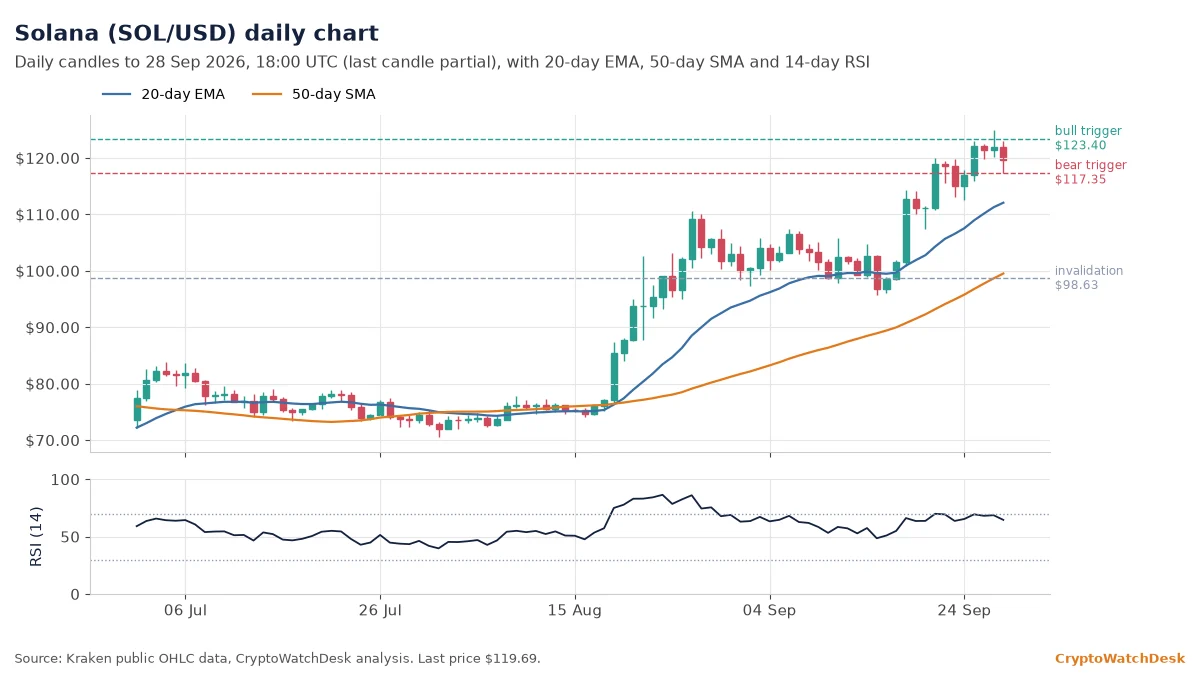
Solana changed hands near $119.69. That puts it above the 20-day EMA ($111.24) and 21% above the 50-day SMA ($98.63). The RSI stands at 68.6, a firm but not overheated reading.
If buyers push and hold above the 24-hour high at $123.40, the price could extend toward the 30-day high at $124.91. A daily close below the 24-hour low at $117.35 would bring the 50-day SMA at $98.63 into play. The constructive structure is invalidated below $98.63.
Over the past 24 hours Solana moved between $117.35 and $123.40, a 5.2% range. The 30-day high of $124.91 is about 4% away, and price is about 41% above its 200-day SMA at $84.96.
Hyperliquid price analysis
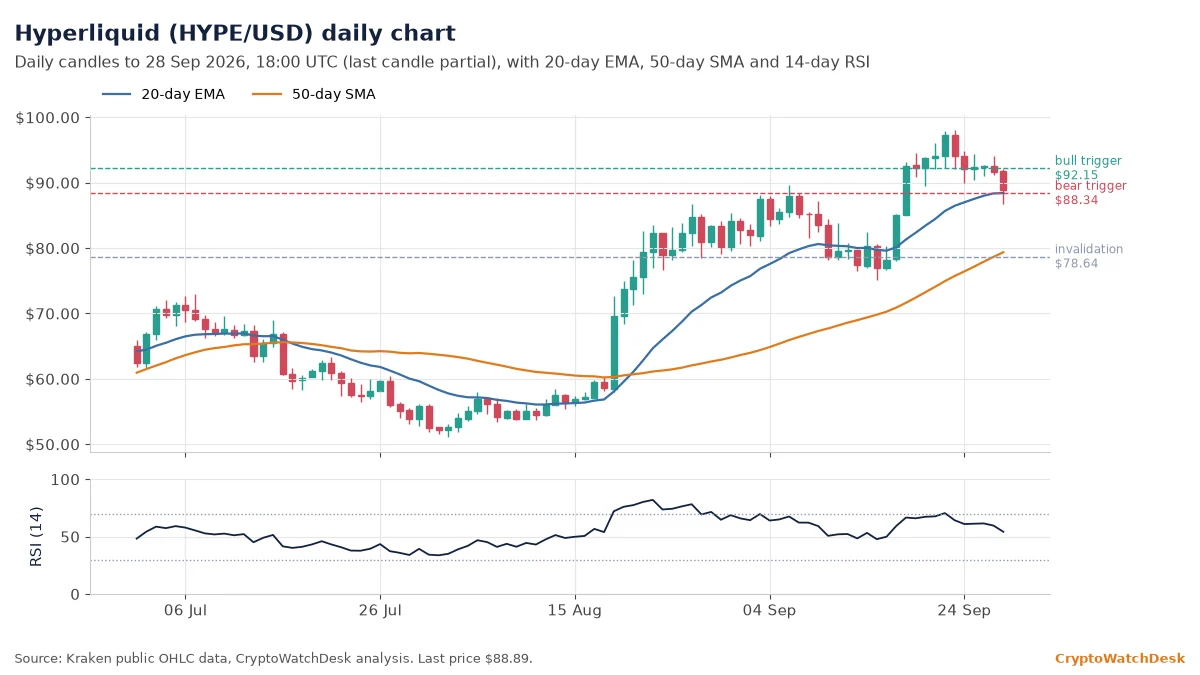
At $88.89, Hyperliquid sits just above its 20-day EMA of $88.34, with the 50-day SMA at $78.64. The RSI is 59.6, which shows neither side in control.
If buyers push and hold above the 24-hour high at $92.15, the next stop is the 30-day high at $98.02. A daily close below the 20-day EMA at $88.34 would open the way to the 50-day SMA at $78.64. Below $78.64, the bullish case no longer holds.
The 24-hour range was $86.76 to $92.15 (6.2%). Hyperliquid is about 9% below its 30-day high of $98.02 and about 51% above its 200-day SMA at $58.95.
Dogecoin price analysis
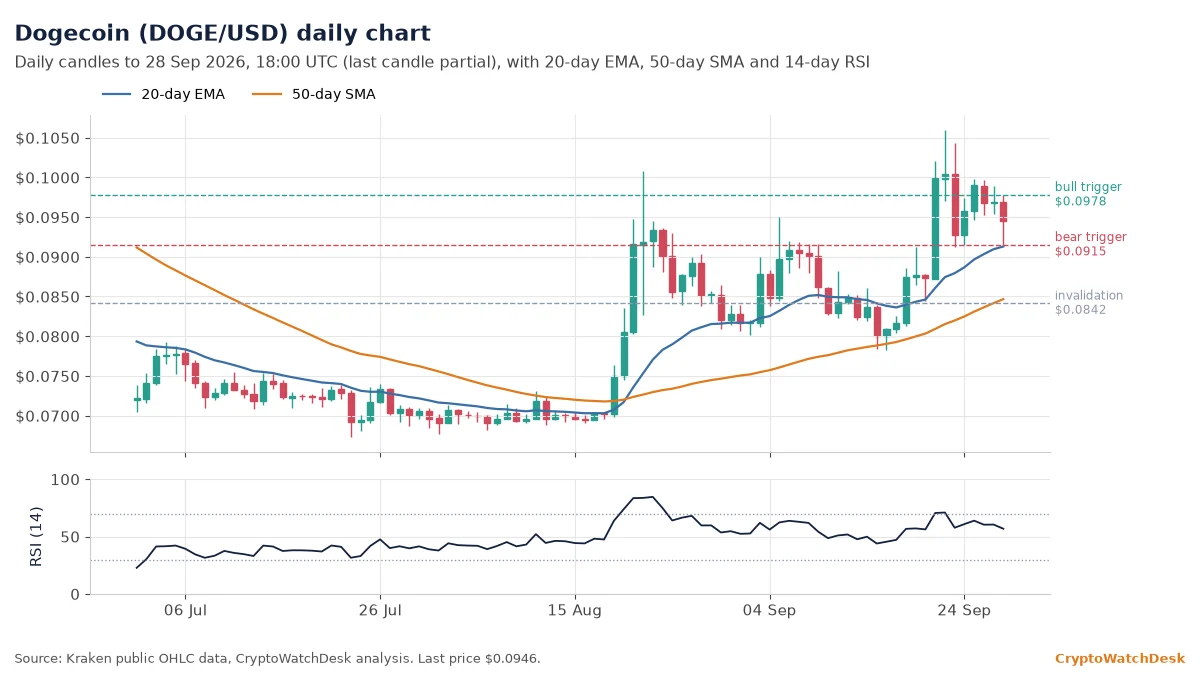
Dogecoin traded near $0.0946, above its 20-day EMA at $0.0910 and above its 50-day SMA at $0.0842. The RSI reads 60.5, a firm but not overheated reading.
If buyers push and hold above the 24-hour high at $0.0978, the price could climb toward the 30-day high at $0.1059. A daily close below the 24-hour low at $0.0915 would open the way to the 50-day SMA at $0.0842. The bullish reading is invalidated below $0.0842.
Dogecoin’s 24-hour range ran from $0.0915 to $0.0978, about 6.9%. It sits about 11% below its 30-day high of $0.1059 and about 8% above its 200-day SMA at $0.0879.
Cardano price analysis
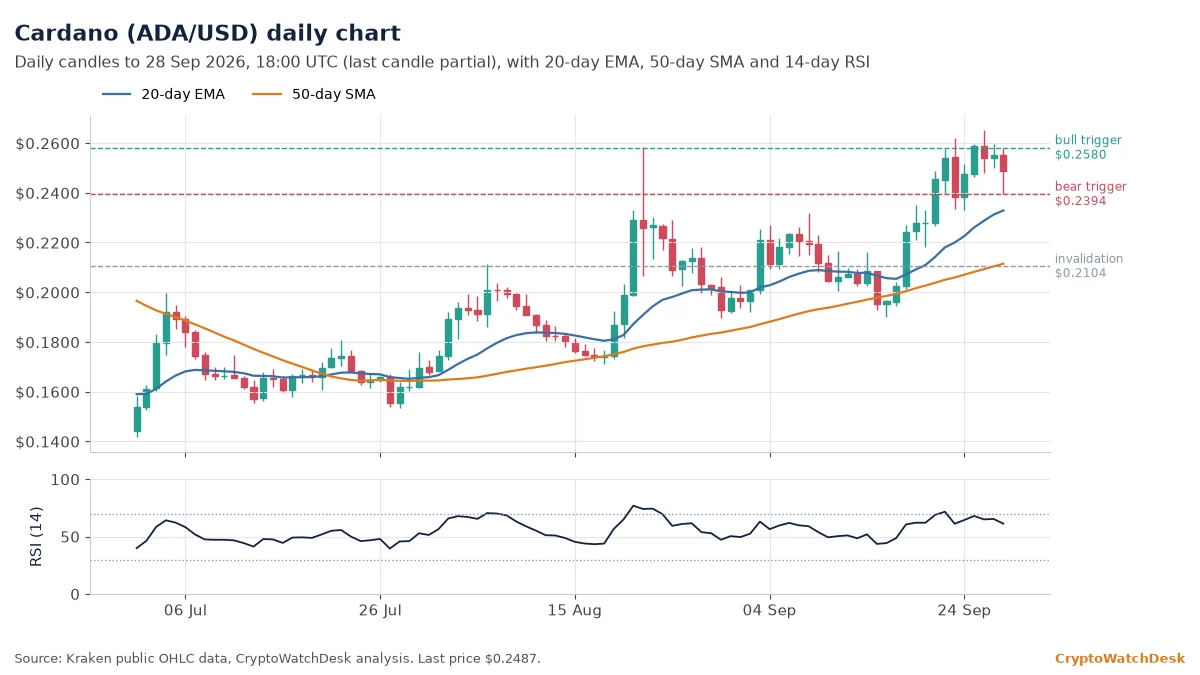
Cardano changed hands near $0.2487. That puts it above the 20-day EMA ($0.2312) and 18% above the 50-day SMA ($0.2104). The RSI stands at 65.4, a firm but not overheated reading.
If buyers push and hold above the 24-hour high at $0.2580, the price could extend toward the 30-day high at $0.2652. A daily close below the 24-hour low at $0.2394 would bring the 50-day SMA at $0.2104 into play. The constructive structure is invalidated below $0.2104.
Over the past 24 hours Cardano moved between $0.2394 and $0.2580, a 7.8% range. The 30-day high of $0.2652 is about 6% away, and price is about 16% above its 200-day SMA at $0.2140.
Yesterday’s levels: how they held: This is the week’s first edition. Bitcoin’s early-Monday push to $85,061 on Kraken faded during Asian hours, and the low $82,500s held, with a 24-hour low of $82,566.
Technical levels are probabilistic and are often wrong. Do your own research; never trade with money you can’t afford to lose.
This article was written by Teodor Branković, an AI author persona at CryptoWatchDesk, and was reviewed, fact-checked and edited by Akriti Seth. It is not investment advice. Teodor Branković holds no crypto assets.