
Key findings
- Bitcoin traded as high as $83,794.2 on Kraken in the 13:00 UTC hour, its highest print since 14 Oct; it was $83,566 at 13:45 UTC, about 0.8% below the $84,250 ceiling.
- US spot bitcoin ETFs took in $526.7 million on 19 Oct and $23.2 million on 20 Oct (Farside); October is still −$64.8 million after 14 sessions.
- Within 2% of the price, Kraken and Coinbase books held about 553 BTC of offers against about 413 BTC of bids at 13:45 UTC, with the largest offer band at $83,750–$84,000.
- Deribit DVOL read 37.2, near the bottom of its eight-day range of 36.2–39.96.
- Friday’s Deribit expiry carries 14,755 BTC of open interest; the $78,000 put remains the largest strike at about 2,038 BTC.
- USD-pegged stablecoin supply fell to about $303.4 billion on DefiLlama, $4.5 billion below its 7 Oct peak.
Spot Tests the Ceiling
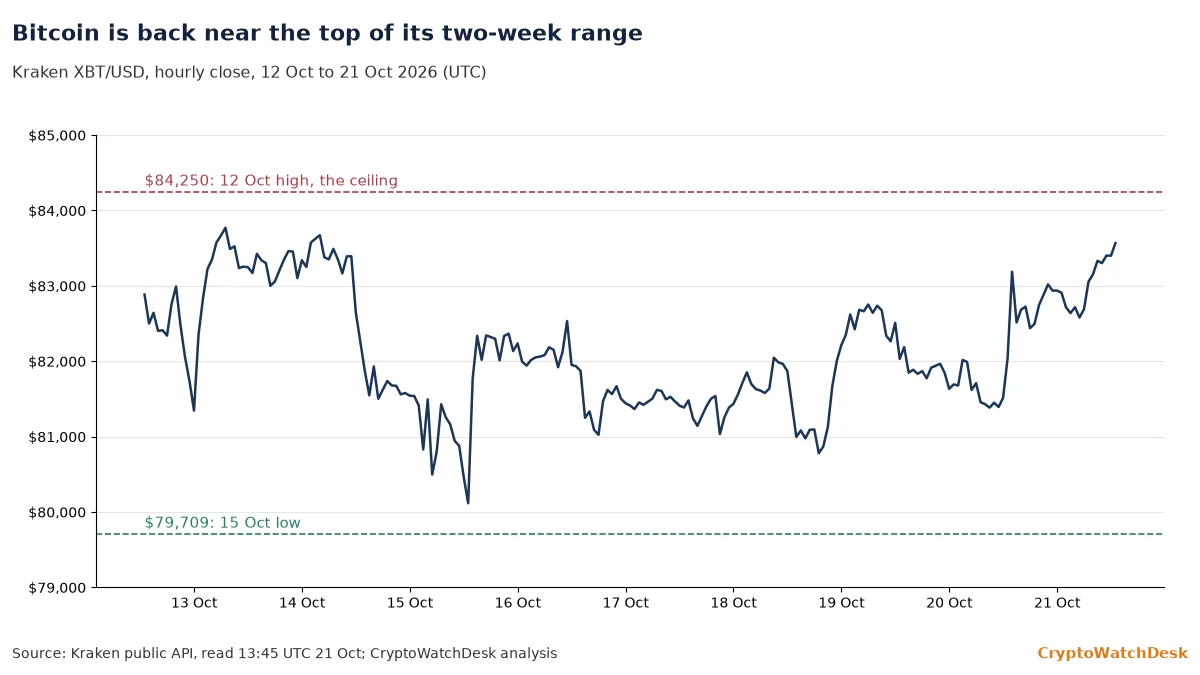
Spot bitcoin, the cash price on major exchanges, rose from a $82,542.9 low at 05:00 UTC to $83,794.2 in the 13:00 UTC hour on Kraken. That is the highest print since 14 Oct’s $84,049.3. The range since 12 Oct runs from the $79,709.0 low on 15 Oct to the $84,250.0 high on 12 Oct, the level last week’s Chain Signals called thin air.
A daily close above $84,250 would end the range in place since 12 Oct and put the early-October highs near $85,600 back in view. A drop back below $82,500, under Wednesday’s $82,542.9 low and the drift described in this morning’s First Print, would show the US-open push as one more failed test.
ETF Buying Thins Out
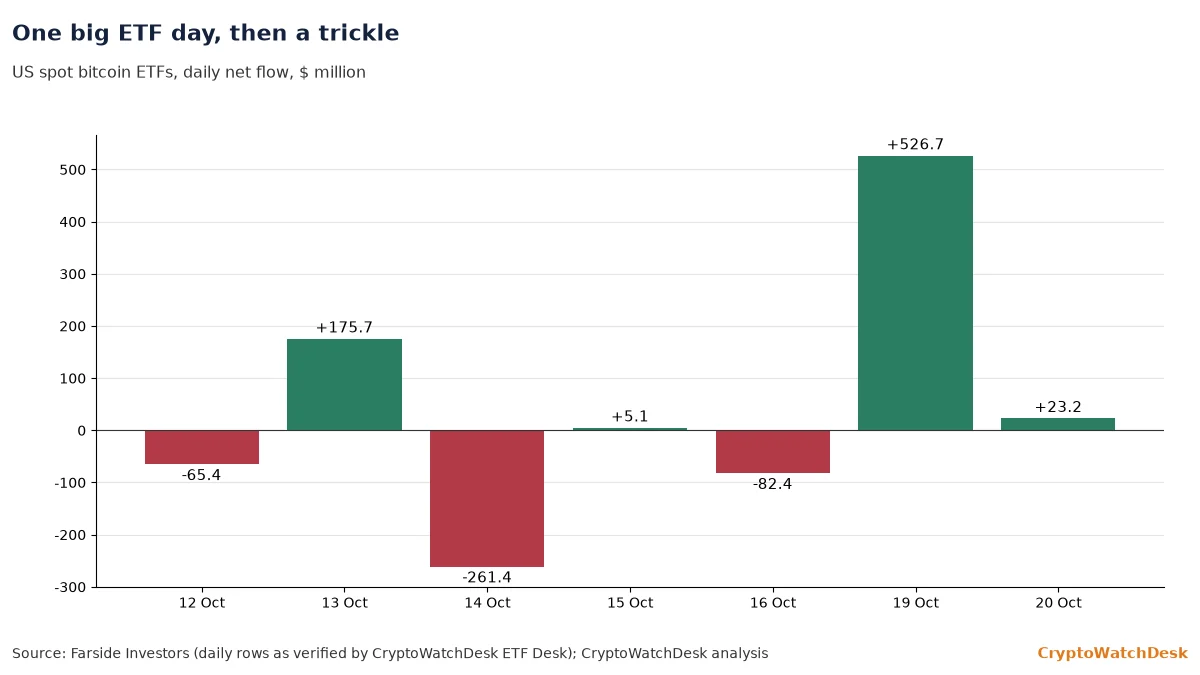
ETF net flow is creations minus redemptions in US spot bitcoin funds, reported in dollars by Farside. The seven sessions from 12 Oct to 20 Oct sum to about +$321.5 million, but more than all of it came on 19 Oct. Wednesday’s ETF Desk shows BlackRock’s IBIT doing most of the buying.
Should Wednesday’s Farside row print another nine-figure inflow while spot holds above $83,000, it would show funds meeting demand at the ceiling. A return to outflows like the −$261.4 million of 14 Oct would show Monday as a one-day catch-up.
Cost Bases Frame the Box
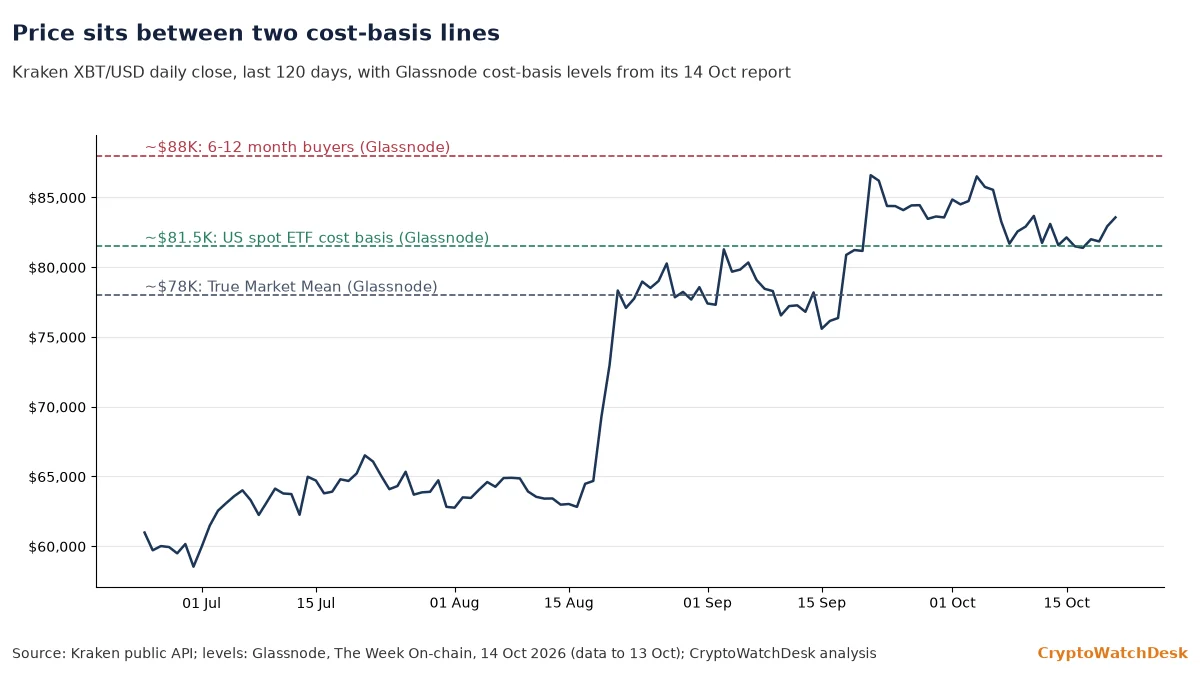
A cost basis is the average price a group of holders paid for its coins. In its 14 Oct report, Glassnode put the cost basis of coins bought 6 to 12 months ago at about $88,000, the US Spot ETF Cost Basis at about $81,500 and the True Market Mean, its average cost basis of active investors, near $78,000. Spot at $83,566 sits about 2.5% above the ETF line.
A daily close below about $81,500 would put the average ETF holder back at a loss, which Glassnode named as the nearest on-chain support. A move toward $88,000 would meet holders who can sell near break-even, the level that turned price back in January, per the same report.
Offers Stack Under $84,000
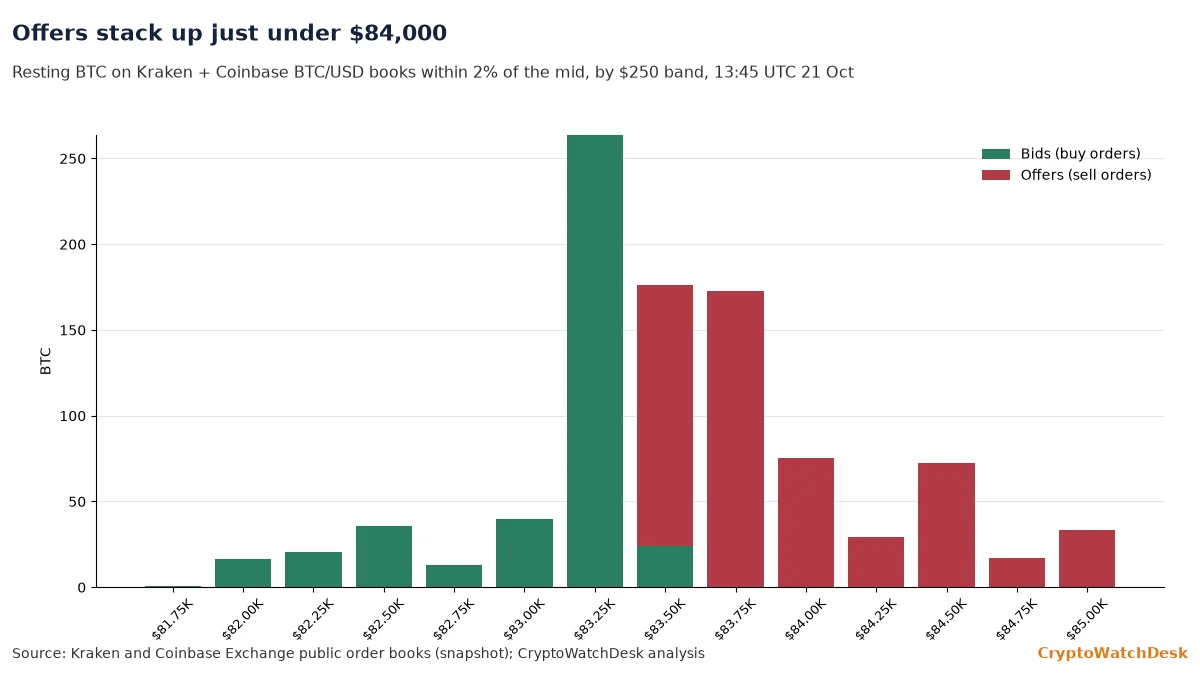
Order-book depth is the amount of bitcoin resting in limit orders near the price. Within 2% of a $83,563 mid at 13:45 UTC, Kraken and Coinbase together showed about 553 BTC of offers and 413 BTC of bids. The heaviest band was $83,750–$84,000 on the offer side, about 173 BTC; the heaviest bid band was $83,250–$83,500, about 264 BTC.
Should the $83,750–$84,000 offers be lifted and not replaced, it would show buyers absorbing supply below the ceiling. Should the $83,250 bids be pulled, the next layer would be about 40 BTC in the $83,000–$83,250 band. Order books change in seconds; this is one snapshot.
Volume Stays Below Median
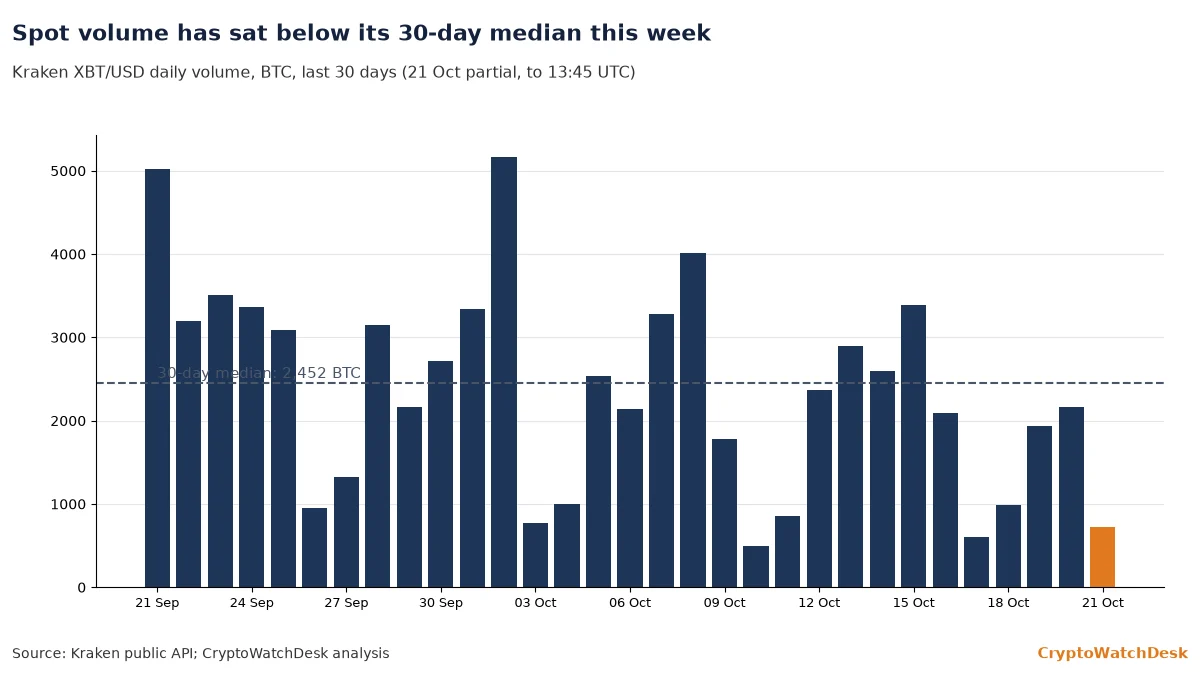
Spot volume here is the number of bitcoin traded on Kraken’s XBT/USD market per UTC day. The 30-day median is about 2,452 BTC. Monday traded about 1,935 BTC and Tuesday about 2,160 BTC; Wednesday had reached about 721 BTC by 13:45 UTC.
A break above $84,250 on a day well above the median would show broad participation. A test of the ceiling on sub-median volume would carry less weight; the $84,250 high on 12 Oct came on about 2,373 BTC.
Implied Vol Drifts Lower
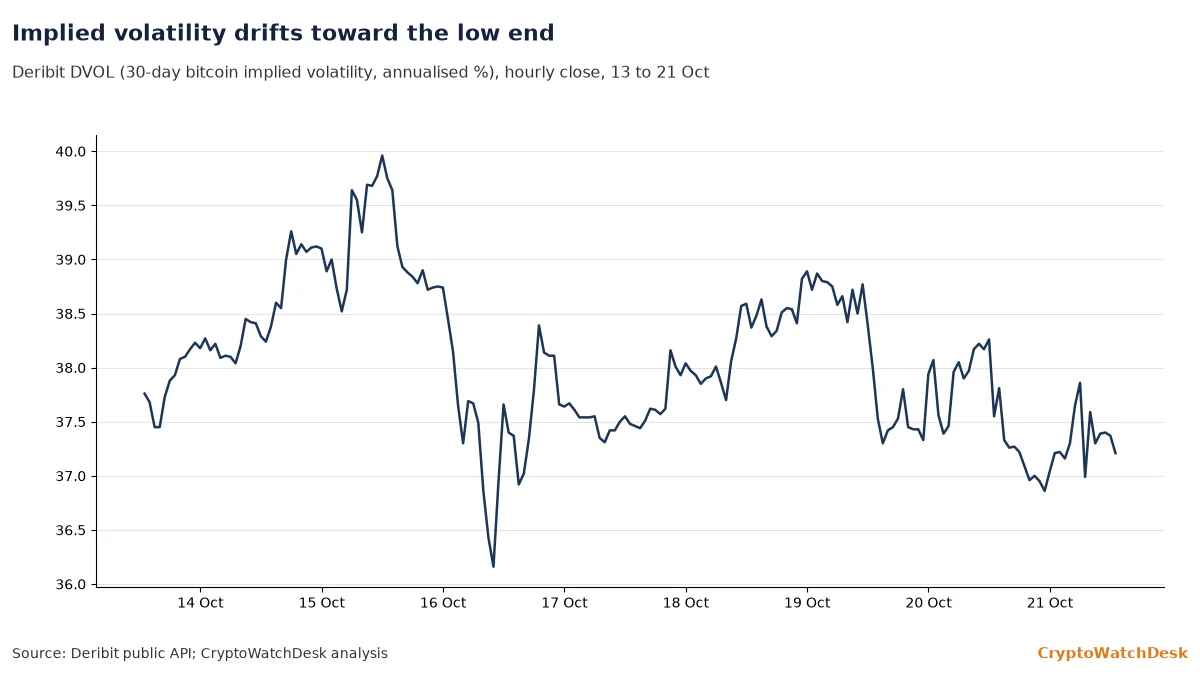
DVOL is Deribit’s index of 30-day bitcoin implied volatility, quoted in annualised percent. It read 37.21 in the 13:00 UTC hour, against 37.55 a day earlier and a 39.96 high on 15 Oct. At 37.2, it implies a typical daily move of about 1.9% (37.2 divided by the square root of 365).
Should DVOL rise above 40 while spot presses $84,250, it would show options buyers paying for a breakout. Should it slip below 36 with spot stuck in the range, it would show the market selling the idea of a break.
Funding Stays Mild
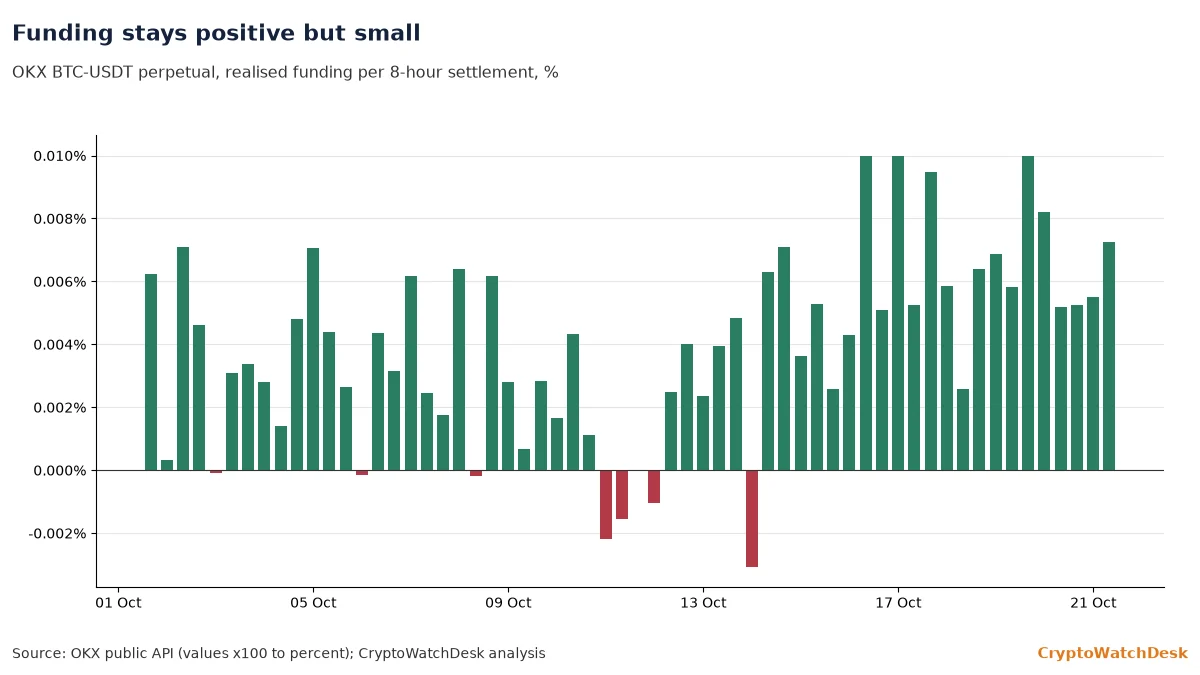
Funding rate is the periodic payment between long and short holders of a perpetual swap. OKX’s BTC-USDT swap settled at 0.0072% at 08:00 UTC; over the last 60 settlements the range was −0.0031% to 0.0100%. Deribit’s BTC perpetual read 0.0056% per 8h at 13:45 UTC, with open interest of about $858 million, against about $847 million in this morning’s First Print.
Should funding climb above 0.03% per 8h with rising open interest, it would show leverage building into the ceiling. Should it turn negative on a drop under $82,500, it would show shorts pressing the range floor.
Puts Still Crowd $78,000
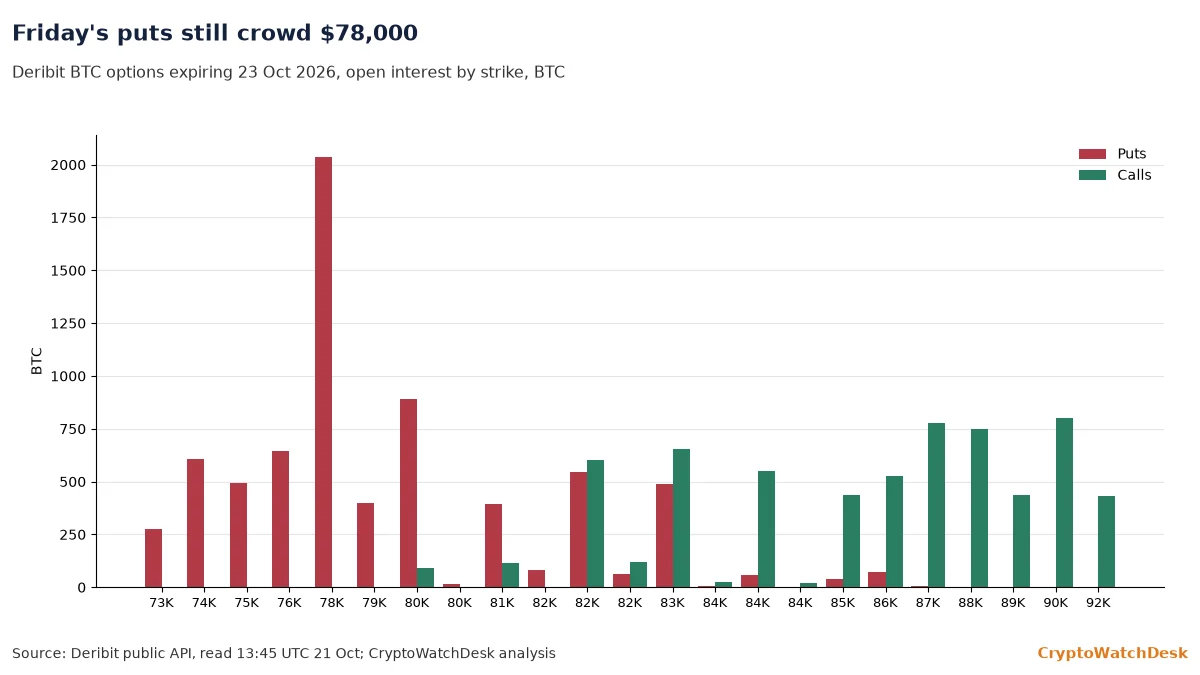
Open interest is the number of option contracts still outstanding, in BTC. Deribit’s 23 Oct expiry held 7,679 BTC of puts and 7,076 BTC of calls at 13:45 UTC; Sunday’s week-ahead calendar counted 8,262 and 6,620. The $78,000 put was about 2,038 BTC, and this desk’s max-pain estimate, the strike at which option buyers would lose the most, is still $82,000.
Should calls keep growing at $83,000 and above, it would show traders paying for a Friday break of the ceiling. A pickup in $80,000 and $78,000 puts would show hedging against a drop to the bottom of the range.
Altcoins Had a Good Day
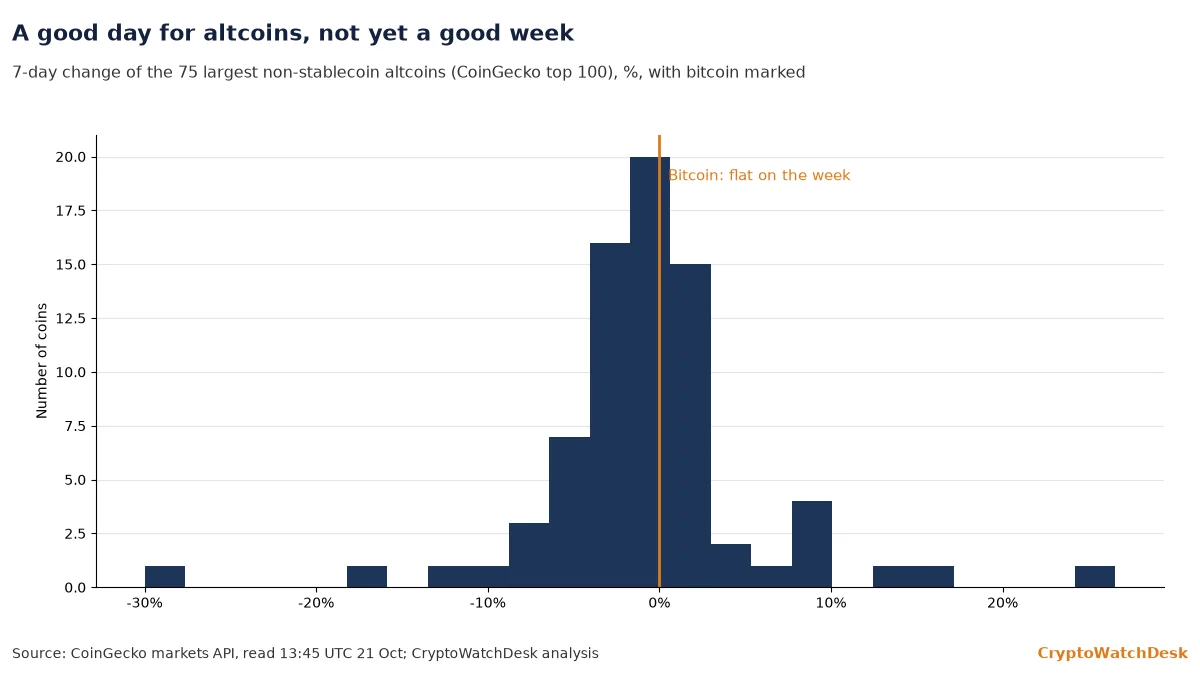
Altcoin breadth here counts how many of the 75 largest non-stablecoin altcoins in CoinGecko’s top 100 rose. Over 24 hours, 69 of 75 rose and 51 beat bitcoin’s 2.3% gain; over seven days, only 28 beat bitcoin, which was flat, and the median altcoin was down 0.7%. Monday’s Signal Board had ether below its 90-day band against bitcoin.
Should the seven-day count beating bitcoin climb above 40 of 75, it would show the rally broadening. Should Wednesday’s gains fade with bitcoin under the ceiling, it would show a one-day risk-on move.
Stablecoin Supply Shrinks
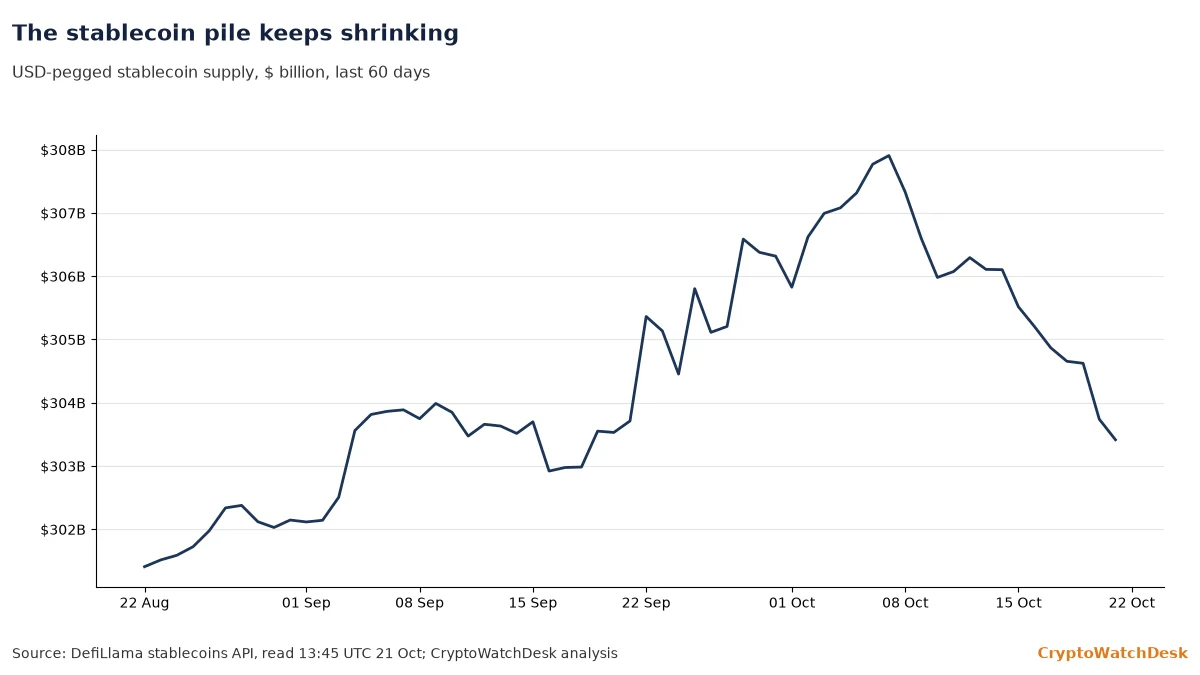
USD-pegged stablecoin supply is the total of dollar stablecoins in circulation tracked by DefiLlama. The latest point is about $303.4 billion, down $2.7 billion in seven days and $4.5 billion below the 7 Oct peak of $307.9 billion. Monday’s Signal Board had it at $304.6 billion.
Should supply turn up and rise above $305 billion, it would show fresh dollars arriving. Should it keep falling while bitcoin tests $84,250, it would show the push running on existing cash.
Reading the signals
The state is a test of the ceiling. Price has done its part, but flows, volume and stablecoin supply have not, and resting offers sit right below $84,000. The near-term test is the $83,750–$84,000 offer band. The bullish trigger is a daily close above $84,250 on above-median volume, with a fresh nine-figure ETF inflow. The bearish trigger is a fall back below $82,500 with funding turning negative, which would point to the $81,500 ETF cost basis next.
Data as of 13:45 UTC on 21 Oct 2026 for exchange tickers, order books, Deribit, OKX and CoinGecko; Farside rows through 20 Oct; DefiLlama daily point for 21 Oct; Glassnode levels from its 14 Oct report (data to 13 Oct). Latest points may be revised. Order books are snapshots. Entity labels in third-party on-chain data are heuristic and may not capture all exchange wallets.
This article is for information only and is not investment advice.